Translate this page into:
Serum Adenosine Deaminase Levels in Tubercular Lymphadenitis: Correlation and Cutoff
 MD, Sharique Ahmad1MD, Nishi Tandon1MD, Andleeb Zehra1MD, Sumaiya Irfan1MD, Noorin Zaidi1MD, Nirupma Lal1MD

-
Received: ,
Accepted: ,
How to cite this article: Gogoi S, Ahmad S, Tandon N, Zehra A, Irfan S, Zaidi N, et al. Serum Adenosine Deaminase Levels in Tubercular Lymphadenitis: Correlation and Cutoff. Glob J Med Pharm Biomed Update 2023;18:29.
Abstract
Objectives:
Tubercular lymphadenitis accounts for the large majority of extrapulmonary tuberculosis (TB) worldwide. The available means for their diagnosis are often time-consuming, tedious, and costly. Adenosine deaminase (ADA) level estimation in body fluids has emerged as a popular method of diagnosing tuberculous infection. Very few studies have examined serum ADA levels in TB lymphadenitis and fewer such studies have used controls. The objective of the present study was to find any correlation between serum ADA and fine-needle aspiration cytology-confirmed tubercular lymphadenitis and, if a correlation existed, whether there existed any diagnostic cutoff for clinical utility.
Material and Methods:
This prospective study was done over 2 years. The patients were grouped into tubercular lymphadenitis (group 1, cases) and non-tubercular lymphadenitis (group 2, controls). Serum ADA level was estimated using the spectrophotometric method. Statistical methods were employed to examine the intergroup differences in serum ADA levels. The receiver operating characteristic curve (ROC curve) was used to assess the overall accuracy and corresponding diagnostic accuracy at different cutoff values of serum ADA.
Results:
Tubercular lymphadenitis (Group I) has a strong female predilection (M: F = 0.56:1, P = 0.017), a significantly late clinical presentation (P = 0.002), and a significantly higher incidence of cervical lymph node involvement (P = 0.019). A positive treatment history was significantly and more commonly found in patients of group 1 (P < 0.001) than patients of group 2. The mean serum ADA level was 43.14 IU/L. A significantly higher serum ADA level was detected in group 1 patients than in group 2 (56.81 ± 12.42 vs. 32.07 ± 6.84, P < 0.001). On ROC, the area under the curve was 97.2%, indicating a very good discriminating capability of serum ADA levels between groups 1 and 2. A cutoff value of 41.90 IU/L had the best sensitivity and specificity (93.15% and 92.1%, respectively) for detecting a tubercular etiology.
Conclusion:
Serum ADA level of 41.90 U/L can differentiate tubercular from non-tubercular lymphadenitis with a very high sensitivity and specificity. Therefore, serum ADA estimation can facilitate an early clinical diagnosis and institution of treatment.
Keywords
Extrapulmonary tuberculosis
Acid-fast bacilli
Diagnosis
Predictive value
Serum adenosine deaminase

INTRODUCTION
Tuberculosis (TB) remains a significant health problem across the world, particularly in developing countries. According to the 2019 data, 10 million new cases of TB were diagnosed worldwide and India contributed nearly 30% of these cases.[1-3]
Extrapulmonary tuberculosis (EPTB) comprises 20–25% of all TB cases.[4-8] Among all sites, lymph nodal involvement (tuberculous lymphadenitis) remains the most frequent form of EPTB. It is seen in up to 40% of EPTB, constituting approximately 15–20% of all cases of TB in India.[9-11]
The diagnosis of TB lymphadenitis requires a cytological study of the affected lymph node followed by a microbiological smear testing and culture. The polymerase chain reaction (PCR) studies have shown better yields (sensitivity 77% and specificity 80%). Open biopsy is only used when fine-needle aspiration cytology (FNAC) has not been diagnostic (sensitivity 80%). To diagnose TB on fine-needle aspiration smears, it is paramount to demonstrate epithelioid cell granulomas with or without caseous necrosis.[12-14] However, a definitive diagnosis is only established when acid-fast bacilli (AFB) are demonstrable on Ziehl–Neelsen staining. However, these methods can be tedious, costly, and often lack sensitivity. Moreover, the lack of widespread availability and inherent delays in establishing diagnosis are the other drawbacks.
Adenosine deaminase (ADA) is a key enzyme in the purine metabolism pathway. It is also a marker of cell-mediated immunity. It has been successfully estimated in body fluids, including serum and has become a popular method of diagnosis of TB infection in general.[13-22] Moreover, very few studies have examined the association between serum ADA and FNAC-positive TB lymphadenitis status.[22] In addition, a smaller sample size and the resultant insignificant statistical impact of the previous studies have remained a major limitation.
The objective of the present study was to find any correlation between serum ADA and FNAC-confirmed tubercular lymphadenitis and, if a correlation existed, whether there existed any diagnostic cutoff for clinical utility.
MATERIAL AND METHODS
In this prospective case–control study, we included consecutive patients presenting to the outpatient clinic between September 2018 and August 2020 (2 years). All eligible patients were enrolled, and their demographic, clinical, cytological data, and serum ADA levels were analyzed.
Inclusion criteria
Patients with lymphadenopathy, irrespective of age and gender were included in the study.
Exclusion criteria
Diagnosed cases of acute lymphadenitis, enteric fever, leprosy, infectious mononucleosis, Chickenpox, and hematopoietic malignancies such as Hodgkin’s lymphoma, metastatic carcinoma cases, and drug-induced lymphadenitis were excluded from the study.
A purposive sampling was used. The sampling population fulfilled the inclusion and exclusion criteria of the study. The sample size was calculated based on variation in ADA levels in group 1 and group 2, using the following formula:
Where σ1 = 2.48 and σ2 = 11.46 are the standard deviations (SDs) of ADA level in the two groups.[4] Type I error (α) = 5% and Type II error (β) = 10% for detecting results with 90% power of study, δ = the min (σ1, σ2) difference considered to be clinically significant. We considered a data loss of 10%.
So, the resultant sample size was:
Total = 150
Group 1 = 75
Group II = 75
All the patients underwent a FNAC followed by hematoxylin and eosin staining for establishing the diagnosis. Based on the FNAC findings, we divided the patients into two groups:
Group 1: Patients confirmed as tubercular lymphadenitis on FNAC
Group 2: Patients confirmed as reactive lymphadenitis on FNAC.
Serum ADA estimation
Sample collection
A pre-procedure informed consent was obtained for all patients. Two to three mililitres of blood was collected in plain vial after venipuncture of the antecubital vein. The sample was centrifuged immediately, and the supernatant serum was subjected to ADA testing using the standardized colorimetric test. Estimation of serum ADA by the spectrophotometric method has been well described by Giusti and Galanti.[23] The estimations were done using the ADA-MTB kit from Micro express, a division of Tulip Diagnostics Pvt. Ltd., India (Reference Range: Normal serum ADA is <30 U/L)
Statistical analysis
The normality of the continuous data was assessed. Continuous data were presented as mean ± SD or median interquartile ranges as appropriate, while categorical data were presented as frequency and percentages. To compare the means/median between two groups, independent sample t-test/Mann– Whitney U-test was used. Chi-square/Fisher exact test was used to compare the proportions between the groups.
Receiver operating characteristic curve (ROC curve) was used to assess the overall accuracy and corresponding diagnostic accuracy at different cutoff values of serum ADA. P < 0.05 will be considered as statistically significant. Statistical Package for the Social Sciences version 23.0, IBM, Chicago, USA, was used for the analysis of the data.
RESULTS
One hundred and sixty-one patients were included in the study. Their demographic and clinical variables are presented in [Table 1]. There were 72 patients (44.7%) with TB lymphadenitis (Gr 1) compared to 81 patients (55.3%) with non-TB lymphadenitis (Gr 2). Although the number of patients in the two groups was not identical, the difference in the number was statistically insignificant (P = 0.180). Demographic and clinical values were compared [Table 2].
| Variables | Frequency | Percent |
|---|---|---|
| Adult versus pediatrics | ||
| Pediatric | 48 | 29.8 |
| Adult | 113 | 70.2 |
| Treatment status | ||
| Treatment | 18 | 11.2 |
| Untreated | 143 | 88.8 |
| LN FNAC | ||
| Group 1 | 72 | 44.7 |
| Group 2 | 89 | 55.3 |
| FNAC finding | ||
| Tubercular lymphadenitis | 72 | 44.7 |
| Chronic lymphadenitis | 89 | 55.3 |
| Family history | ||
| Contributory | 16 | 9.9 |
| Non-contributory | 145 | 90.1 |
| Dietary history | ||
| Non-vegetarian | 99 | 61.5 |
| Vegetarian | 62 | 38.5 |
| Swelling | ||
| Cervical | 133 | 82.6 |
| Inguinal | 13 | 8.1 |
| Axillary | 15 | 9.3 |
| Duration symptoms | ||
| Up to 3 months | 95 | 59.0 |
| More than 3 months | 66 | 41.0 |
| Marital status | ||
| Married | 60 | 37.3 |
| Unmarried | 101 | 62.7 |
LN: Lymph node, FNAC: Fine-needle aspiration cytology
| Variables | Group 1 (n=72, 44.7%) n(%) |
Group 2 (n=89, 55.3%) n(%) |
P-value |
|---|---|---|---|
| Age (Years) | 24.31±13.70 | 28.16±17.45 | 0.128 |
| Pediatric population (<18 years) | 22 (30.6) | 33 (37.1) | 0.408 |
| Male | 26 (36.1) | 49 (55.1) | 0.017 |
| Marital status (Married) | 24 (33.3) | 36 (40.4) | 0.353 |
| Presentation within 3 months of symptoms | 33 (45.8) | 62 (69.7) | 0.002 |
| Cervical swelling | 62 (86.1) | 71 (79.8) | 0.019 |
| Inguinal swelling | 8 (11.1) | 5 (5.6) | 0.27 |
| Axillary swelling | 2 (2.8) | 13 (14.6) | 0.047 |
| Contributory family history | 10 (13.9) | 6 (6.7) | 0.08 |
| Contributory treatment history | 16 (22.2) | 2 (2.2) | <0.001 |
| Mean serum ADA | 56.82±12.43 | 32.08±16.85 | <0.001 |
Means were compared by Independent samples t-test used. Percentage compared by Chi-square test/Fisher exact test used. P<0.05 significant. ADA: Adenosine deaminase. Bold Values: The P-values in bold letters indicate statistically significant observations (P<0.05 has been considered statistically significant)
Our study shows that tubercular lymphadenitis (Group I) has a strong female predilection (M: F = 0.56:1, P = 0.017). The clinical presentation was significantly delayed in group 1 (P = 0.002). While both groups of lymphadenitis were more common in the cervical region, group 1 had a significantly higher incidence of cervical node involvement (P = 0.019).
The involvement of axillary lymph nodes was significantly lower in group 1 than group 2. A positive treatment history was significantly and more commonly provided by patients in group 1 (P < 0.001) than in group 2. The mean serum ADA level of this study was 43.14 IU/L and group 1 showed a significantly higher elevation of serum ADA levels than group 2 (56.82 IU/L vs. 32.07 IU/L, P < 0.001).
The mean serum ADA level was 43.14 IU/mL (range: 22.04–97.245 IU/mL). [Table 3] shows the distribution of the patients between the two groups with respect to the various ranges of serum ADA levels in our study groups.
| Serum ADA range (U/L) | Group 1 (n=72, 44.7%) n(%) |
Group 2 (n=89, 55.3%) n(%) |
P-value |
|---|---|---|---|
| 21–30 | 0 | 37 (41.6) | <0.001 |
| 31–40 | 3 (4.2) | 39 (43.8) | <0.001 |
| 41–50 | 24 (33.3) | 12 (13.5) | 0.005 |
| 51–60 | 19 (26.4) | 1 (1.1) | 0.001 |
| 61–70 | 17 (23.6) | 0 | <0.001 |
| 71–80 | 7 (9.7) | 0 | 0.003 |
| 81–90 | 2 (2.8) | 0 | 0.198 |
Chi-square test/Fisher exact test used P<0.001.ADA: Adenosine deaminase
As the table shows, the intergroup difference in ADA value ranges was statistically significant. While no patient with TB lymphadenitis had ADA values between 21 U/L and 30 U/L, nearly 40% of the non-tubercular lymphadenitis group had ADA values between 21 U/L and 30 U/L. Similarly, no patient in group 2 had ADA values more than 60 U/L. The table also clearly shows that serum ADA levels most frequently hovered between 41 U/L and 50 U/L in our study (n = 24, 33.3%), while 50% of the patients had ADA values between 51 U/L and 70 U/L (n = 36).
To assess the diagnostic accuracy of serum ADA, an independent t-test was used to compare the mean serum ADA levels. The results showed significantly higher serum ADA levels in group 1 patients than those in group 2 (56.81 ± 12.42 vs. 32.07 ± 6.84, P < 0.001) [Figure 1].

- Distribution of serum adenosine deaminase between two study groups.
On ROC analysis, the area under the curve (AUC) was 97.2%, indicating a very good discriminating capability of serum ADA levels to differentiate the two groups. We identified the discriminatory cutoff level of serum ADA by balancing the sensitivity and the specificity while being mindful that both should be at least more than 50%. A cutoff value of 40.67 IU/L had a sensitivity of 95.8% and a specificity of 88.8%. At another cutoff value of 41.90 IU/L, the corresponding sensitivity and specificity were 93.15% and 92.1%, respectively. Similarly, at a cutoff value of 44.52 IU/L, the sensitivity slightly decreased to 90.37% while the specificity increased to 96.6%. Therefore, a cutoff value of 41.90 IU/L provided a very high and comparable sensitivity and specificity. Thus, serum ADA levels of 41.90 IU/L appear to be a very efficient method to diagnose tubercular lymphadenitis in the absence of a histo/cytological diagnosis of TB [Figure 2].
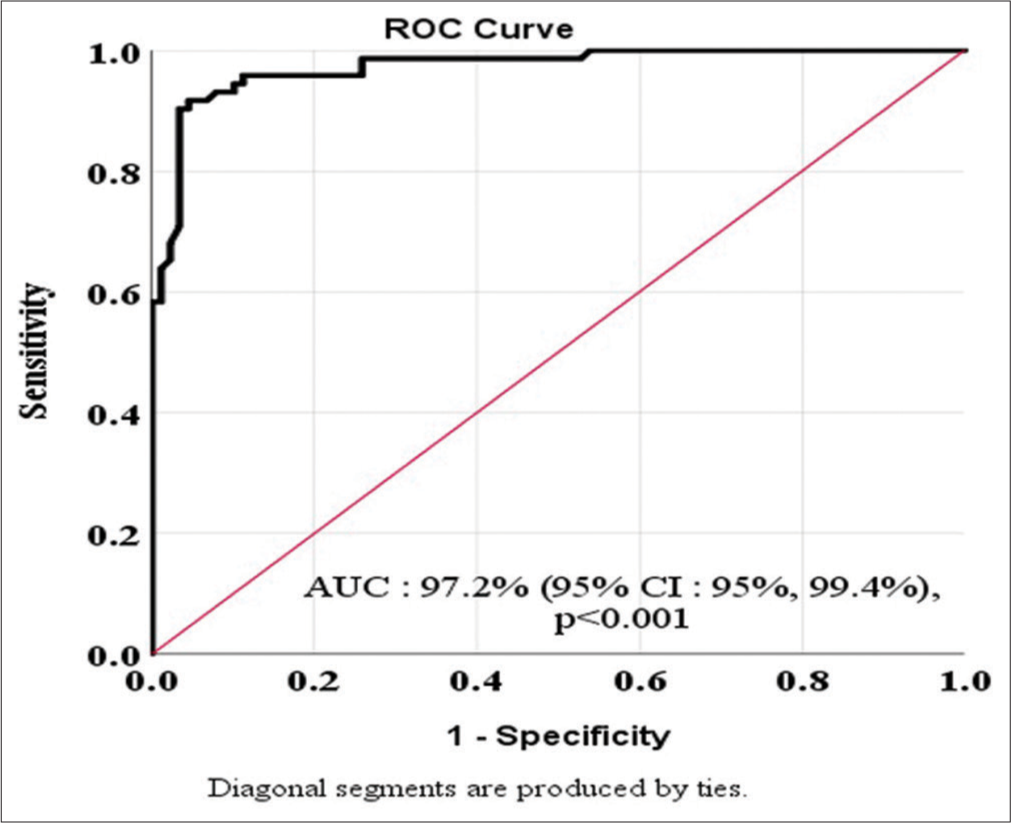
- Area under receiver operating characteristic (ROC) curve showing the diagnostic accuracy of the serum adenosine deaminase of the study patients.
DISCUSSION
Serum ADA level was significantly higher in group 1 patients than in group 2 patients (56.81 ± 12.42 vs. 32.07 ± 6.84, P < 0.001). While no patient with TB lymphadenitis had ADA values between 21 IU/mL and 30 IU/mL, nearly 40% of the non-tubercular lymphadenitis group had ADA values between 21 IU/mL and 30 IU/mL.
Similarly, no patient in group 2 had ADA values more than 60 IU/mL. The most frequent serum ADA levels were between 41 IU/mL and 50 IU/mL in our study (n = 24, 33.3%) while 50% of the patients had ADA values between 51 IU/mL and 70 IU/mL (n = 36). In a recent study, Arafat et al. did not find any statistical significance between similar comparisons made at their university.[22] Our study showed that ADA levels in Gr1 patients were mostly on the higher side. A delayed clinical presentation might explain our findings. Previous studies have shown that ADA levels tend to parallel the disease progression.
A curve (AUC) of 97.2% indicated a very good discriminating capability of serum ADA levels in our model. We identified the cutoff value of serum ADA by balancing the sensitivity and the specificity while keeping in mind that both should be at least more than 50%. A cutoff value of 41.90 IU/L provided the best sensitivity and specificity among the three such cutoffs tested (sensitivity and specificity were 93.15% and 92.1%, respectively). Thus, serum ADA levels of 41.90 IU/L appear to be a very efficient method to diagnose tubercular lymphadenitis in the absence of a histo/cytological diagnosis of TB.
A review of the literature revealed the previous studies dealing with this subject. Almost all previous authors concluded that serum ADA levels were significantly raised in pulmonary TB.[7,13,15,16] Interestingly, Tarhan et al.[16] studied serum ADA and plasma platelet factor 4 (PF-4) in four subsets of patients, namely, active pulmonary TB, sero-positive human immunodeficiency virus (HIV) infection, patients with hematologic cancer, and healthy controls. They found that serum ADA may be elevated in active TB and seropositive HIV but PF-4 is specifically elevated in active pulmonary TB. This study shows that serum ADA and PF-4 may have a supplementary diagnostic role in the diagnosis of active pulmonary TB and the predictive accuracy of serum ADA may be enhanced by simultaneous estimation of PF-4.
To the best of our knowledge, only one previous study by Arafat et al.[22] attempted to correlate serum ADA levels with tubercular lymphadenitis status. They found that the mean serum ADA concentration was 25.52 ± 7.11 in tuberculous lymphadenitis and in non-tuberculous lymphadenopathy patients, it was 27.29 ± 15.91U/L with no significant difference (P = 0.480). The study concluded that there was a statistically significant elevation of serum ADA in non-Hodgkin lymphoma and sarcoidosis than in tuberculous lymphadenitis. Our findings are, however, contrary to what they published.
Whereas our study has shown that serum ADA levels are significantly elevated in TB lymphadenitis, we could not find any gender-based difference. We, however, observed that the maximum elevation of serum ADA levels (mean value >60 U/L) occurred in the first two decades of life.
Strengths of the study
The major strength of our study is the prospective cross-sectional design and a high patient accrual. Another strength of our study was the inclusion of the control group. Such a high number of patients and controls allowed us to achieve statistical significance in many of our findings. Our study is the largest to date that compared serum ADA levels and proposed a cutoff value with very high sensitivity and specificity. Therefore, our findings would make a valuable contribution to the literature.
Limitations of the study
Despite having a large number of patients and statistically significant findings, there were certain drawbacks to our study. The foremost was the lack of AFB staining and culture of the FNAC specimen. This could have shown us better associations between histological features and serum ADA levels. Moreover, we did not estimate serum ADA levels prospectively in the same patient which could have given us more insights into the dynamics of serum ADA levels with treatment as shown in some previous studies. We also did not correlate our serum ADA findings with measures of the disease burden such as number and size of lymph node involvement and tissue PCR status.
CONCLUSION
Serum ADA level estimation is a widely available, feasible, and cost-effective investigation modality. As our study showed, it can be employed to diagnose tubercular lymphadenitis, either in the absence of a cellular or tissue diagnosis (FNAC/biopsy) or in the event of an ambiguous finding in those studies. A serum ADA level of 41.90 U/L can clearly differentiate tubercular from non-tubercular lymphadenitis with very high sensitivity and specificity. Therefore, the usage of serum ADA as an investigation will allow an early disease diagnosis and institution of anti-tubercular therapy at the earliest opportunity and contribute to improvement in the overall patient outcomes.
Declaration of patient consent
The authors certify that they have obtained all appropriate patient consent.
Conflicts of interest
There are no conflicts of interest.
Use of artificial intelligence (AI)-assisted technology for manuscript preparation
The authors confirm that there was no use of artificial intelligence (AI)-assisted technology for assisting in the writing or editing of the manuscript and no images were manipulated using AI.
Financial support and sponsorship
Nil.
References
- RNTCP Status Report, Central TB Division, Directorate General of Health Sciences, Ministry of Health and Family Welfare. Nirman Bhavan, New Delhi.
- [Google Scholar]
- Index-TB Guidelines: Guidelines on Extrapulmonary Tuberculosis for India. Indian J Med Res. 2017;145:448-63.
- [Google Scholar]
- Tuberculosis Control in the South-East Asia Region Annual TB Report 2015 New Delhi: World Health Organization, Regional Office for South-East Asia; 2014. p. :61.
- [Google Scholar]
- Significance of Adenosine Deaminase Serum Concentration in the Diagnosis of Extra-Pulmonary Tuberculosis. J IMAB. 2011;17:130-4.
- [CrossRef] [Google Scholar]
- Nodal Tuberculosis Revisited: A Review. J Infect Dev Ctries. 2012;6:6-12.
- [CrossRef] [PubMed] [Google Scholar]
- Management of Peripheral Lymph Node Tuberculosis in Routine Practice: An Unselected 10-Year Cohort. Int J Tuberc Lung Dis. 2011;15:375-8.
- [Google Scholar]
- Tuberculosis of the Lymph Nodes: Many Facets, Many Hues. Astrocyte. 2017;4:80-6.
- [CrossRef] [Google Scholar]
- Tuberculous Lymphadenitis: Correlation of Cellular Components and Necrosis in Lymph-Node Aspirate with AFB Positivity and Bacillary Count. Indian J Pathol Microbiol. 1990;33:1-10.
- [Google Scholar]
- Validity of Serum Adenosine Deaminase in Diagnosis of Tuberculosis. Pan Afr Med J. 2013;15:133.
- [CrossRef] [PubMed] [Google Scholar]
- Valeur Diagnostique de L'activité de L'adénosine Désaminase Pleurale et Sérique Dans la Pleurésie Tuberculeuse [Diagnostic Value of Serum and Pleural Fluid Adenosine Deaminase Activity in Tuberculous Pleurisy] Ann Biol Clin (Paris). 2006;64:265-70.
- [Google Scholar]
- Adenosine Deaminase Activity in Serum and Pleural Effusions of Tuberculous and Non-Tuberculous Patients. Biochem Mol Biol Int. 1997;43:763-79.
- [CrossRef] [PubMed] [Google Scholar]
- Serum Adenosine Deaminase Enzyme and Plasma Platelet Factor 4 Activities in Active Pulmonary Tuberculosis, HIV-Seropositive Subjects and Cancer Patients. J Infect. 2006;52:264-8.
- [CrossRef] [PubMed] [Google Scholar]
- A Study of Serum Adenosine Deaminase Activity in Sputum Negative Patients of Pulmonary Tuberculosis. Indian J Tuberc. 1991;38:139-41.
- [Google Scholar]
- Study of Adenosine Deaminase Activity in Pulmonary Tuberculosis and other Common Respiratory Diseases. Indian J Clin Biochem. 2004;19:129-31.
- [CrossRef] [PubMed] [Google Scholar]
- A Comparative Study and Evaluation of Serum Adenosine Deaminase Activity in the Diagnosis of Pulmonary Tuberculosis. Biomed Res. 2010;21:189-94.
- [Google Scholar]
- Serum Adenosine Deaminase (ADA) in Differential Diagnosis of Pulmonary Tuberculosis and Common non Tubercular Respiratory Diseases. Indian J Tuberc. 1988;35:25-7.
- [Google Scholar]
- Sensitivity, Specificity, Negative and Positive Predictive Values of Adenosine Deaminase in Patients of Tubercular and Non-tubercular Serosal Effusion in India. J Clin Med Res. 2010;2:121-6.
- [CrossRef] [PubMed] [Google Scholar]
- Value of Serum Adenosine Deaminase (ADA) in Distinguishing between Tuberculous and Non-tuberculous Lymphadenopathies. Mymensingh Med J. 2021;30:704-9.
- [Google Scholar]
- Methods of Enzymatic Analysis Vol 4. (3rd ed). Weinhem: Verlag Chemie; 1984. p. :315-23.
- [Google Scholar]