Translate this page into:
A Review of Clinical Biomarker Insights: Advances in Diagnosis and Prognosis of Early Alzheimer


*Corresponding author: Ramanathan Rajagopalan, Department of Pharmaceutics, Periyar College of Pharmaceutical Sciences, Tiruchirappalli, Tamil Nadu, India. rajagopalan10@gmail.com
-
Received: ,
Accepted: ,
How to cite this article: Rajagopalan R, Hariharan S, Akshaya NR, Senthamarai R. A Review of Clinical Biomarker Insights: Advances in Diagnosis and Prognosis of Early Alzheimer. Glob J Med Pharm Biomed Update. 2025;20:5. doi: 10.25259/GJMPBU_38_2024
Abstract
The research focuses on the use of biomarkers to diagnose Alzheimer’s disease (AD) in living individuals. Biomarkers for AD are grouped into Aβ deposition, pathologic tau, and neurodegeneration. Other potential candidates for AD, which include Neurofilament light (NEFL) protein, glial fibrillary acidic protein (GFAP), and growth differentiation factor 15 (GDF15), have been found in recent studies in addition to the Aβ and tau proteins. This review primarily addresses the methods used in the study, which was published in the journal Nature Aging, to measure biomarkers using fludeoxyglucose positron emission tomography, single molecule array, cerebospinal fluid sampling and blood proteomics, and dementia investigation to date. Inferred from the analysis, plasma proteins, NEFL, GFAP, and GDF15 were shown to be highly rated in protein significance ranking and to be most consistently linked with incident dementia and AD. An individual with greater GFAP levels is 2.32 times likely to acquire dementia. Early diagnosis is crucial for those with dementia, as it ensures that they receive the help and support they need. Furthermore, new drugs, such as donanemab and lecanemab, may be able to delay the progression of AD.
Keywords
Amyloid β
Biomarkers
Early Alzheimer’s
Glial fibrillary acidic protein
Monoclonal antibodies
Neurofilament light
Positron emission tomography
Tau

INTRODUCTION
With the advent of genomics, biomarker research has entered a new phase, promising early detection and successful treatment of a wide variety of disorders.[1] The biomarkers have a crucial role in the early identification of Alzheimer’s disease (AD) illnesses before they progress to the dementia stage. These biomarkers can be used as reference validation procedures for other alternative biomarkers found in human bodily fluids.[2]
ALZHEIMER’S DISEASE
Alzheimer’s disease is a degenerative neurological condition that mainly affects behavior, memory, and cognitive functions. Aging is the foremost factor of AD butgenetics, head trauma, vascular illnesses, infections, and environmental variables are additional risk factors. Alzheimer’s is the most typical form of dementia, making up 65–80% cases, and is eminent by intracellular neurofibrillary tangles and extracellular amyloid plaques.[3] The rapid advancement of blood biomarkers is crucial for accurately distinguishing AD points to their prompt application in clinical programs and clinical trials. This application is especially significant for patients with preclinical AD, since adaptive and less intrusive biomarkers are required to screen large groups of cognitively unimpaired (CU) people to evaluate novel interventions.
“Biomarker,” a portmanteau of “biological marker” is defined as “a characteristic that is objectively measured and evaluated as an indicator of normal biological processes, pathogenic processes, or pharmacologic responses to a therapeutic intervention.”[4] Although established positron emission tomography (PET) and cerebrospinal fluid (CSF) have excellent diagnostic properties, their limited accessibility and invasiveness (CSF measures require a lumbar puncture [LP], and PET requires infusion of stable isotopes and radiation exposure), relative drug interactions (anticoagulant medication may preclude LP), and are exorbitant.[5]
In 2011, the Alzheimer’s Association issued diagnosis recommendations for cognitive impairment, preclinical, and dementia phases of AD . The current study focuses on using biomarkers to predict early AD. Biomarkers are classified as β amyloid deposition, pathologic tau, and neurodegeneration.[6] In addition to Aβ and tau proteins, new investigations have revealed alternative possibilities for the investigation of AD, such as the neurofilament light (NEFL) protein, glial fibrillary acidic protein (GFAP), and growth differentiation factor 15 (GDF15).[7,8]
In recent years, there has been an explosion of sensitive and specific blood biomarkers for AD along with related disorders. This study discusses a fascinating field that has the potential to transform AD diagnoses and disease monitoring. Finally, the study discusses the practical elements of blood-based biomarker-supported AD diagnoses, emphasizing the significance of biomarker interpretation in a comprehensive clinical context.
PATHOGENESIS
The pathogenesis of AD involves multiple components and alterations in various cell types within the central nervous system (CNS). Key mechanisms [Figure 1][9] and [Table 1] include: Neurons synthesize Aβ, which is subsequently released into the extracellular matrix. Astrocytes and microglia can either break down or remove it. Accumulation of Aβ, caused by increased synthesis or inadequate clearance, may induce neuronal dysfunction, glial activation, and neuroinflammation.[10] Tau is mostly induced in neurons and undergoes a variety of post-translational modifications (PTMs). Abnormal PTMs, liquid-liquid phase separation, and pathogenic tau can all result in tau aggregation and buildup, which can spread throughout the illness and involve glial cells in seeding and dispersion. Glial cells, including microglia and astrocytes, play crucial roles in Aβ clearance and tau pathogenesis. Dysfunction in these cells can accelerate the progression of AD. Mitochondrial dysfunction and poor autophagy can worsen AD by intensifying oxidative damage, Aβ generation, and tau phosphorylation. Genetic liability factors for early-onset AD include abnormalities in genes such as amyloid precursor protein (APP) and PS1/2 that alter Aβ production. Delayed onset of AD is linked to genetic risk factors, such as the E4 variant in the APOE gene, which impacts Aβ clearance and glial function. Poor diet and lack of physical exercise as well as environmental and metabolic risk factors including diabetes, cerebrovascular illness, head injury, and stress, can all raise the chance of developing AD.[16]
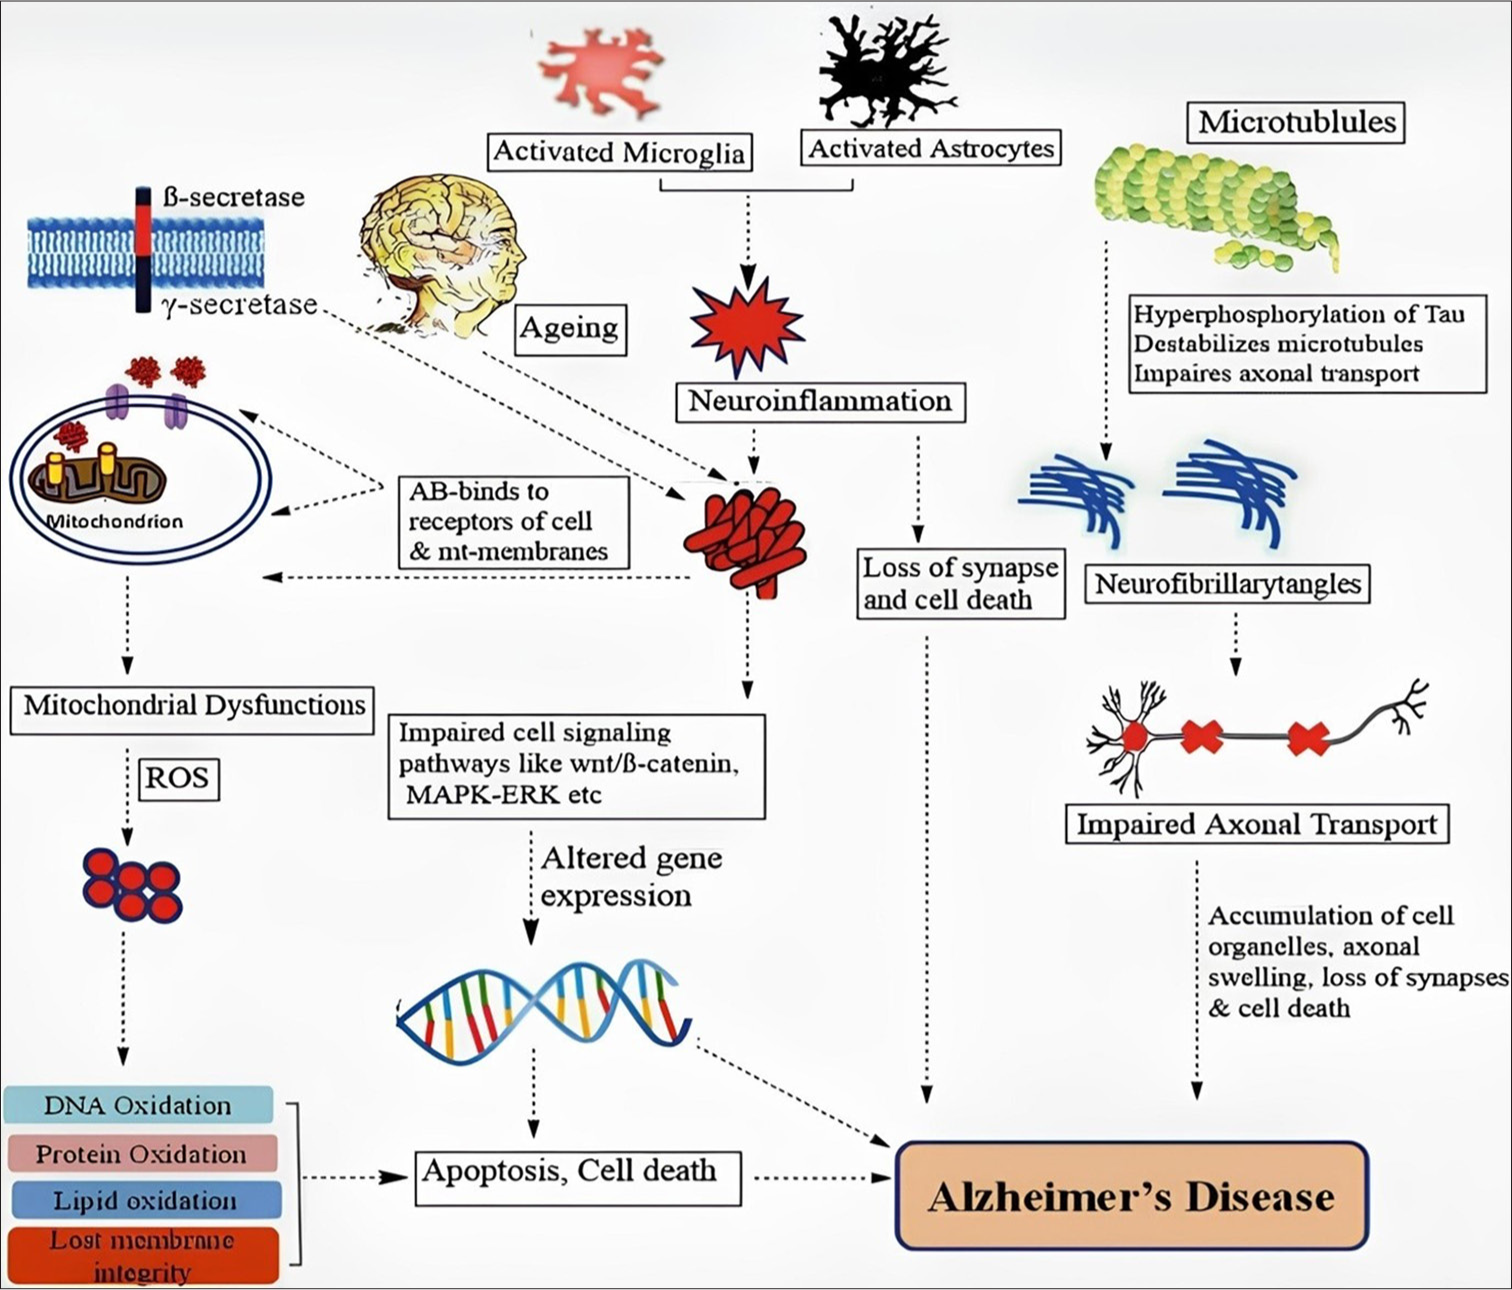
- Key mechanism involved in the pathogenesis of Alzheimer’s.
| Sr. No. | Biomarkers | Main feature | References |
|---|---|---|---|
| 1. | Amyloid beta (Aβ42) | Reduced AβCSF levels (50% of normal Aβ42) due to brain aggregation and senile plaques; amyloid PET, with 3 approved tracers, is key in cognitive impairment diagnosis, and Aβ42/Aβ40 ratio closely correlates with amyloid PET results. | [11,12] |
| 2. | Aβ42/40ratio | Fully automated immunoassays of the Aβ42/40 ratio in cerebrospinal fluid offer a more reliable biomarker for amyloid positivity in Alzheimer’s disease, accounting for interpatient variability and effectively distinguishing PET-positive from PET-negative individuals. | [11,12] |
| 3. | Phosphorylated-TAU | CSF levels of total and phosphorylated TAU are key biomarkers for Alzheimer’s disease, reflecting neurofibrillary tangles and neuronal degeneration, while advances in plasma P-TAU181 and P-TAU 217 biomarkers offer improved diagnostic potential, though Tau tracers remain limited by decomposition and lack of selectivity. | [5,12] |
| 4. | Glial fibrilary acidic protein (GFAP) | GFAP, an astrocytic cytoskeleton protein, is elevated in AD patients, particularly near Aβplaques and in regions with tau accumulation, and its elevated levels in plasma can detect AD pathology, predict conversion to dementia, and serve as a promising early biomarker for AD in clinical settings. | [13,14] |
| 5. | Neurofilament light chain (NEFL) | NEFL, a biomarker of neuroaxonal damage expressed in myelinated axons, can be measured in CSF and plasma/serum, with elevated levels indicating axonal damage and appearing in familial AD mutation carriers years before clinical onset. | [14,15] |
| 6. | Growth differentiation factor (GDF15) | GDF-15, an anti-inflammatory, proapoptotic cytokine involved in stress response, is linked to brain, liver, and heart damage, plays a role in Aβclearance, and elevated levels in circulation are associated with increased risk and progression of Alzheimer’s disease. | [14,15] |
AD: Alzheimer’s disease, Aβ: Amyloid Beta, CSF: Cerebrospinal fluid, PET: Positron emission tomography, TAU: Tau protein, GFAP: Glial fibrillary acidic protein, NEFL: Neurofilament light chain, GDF15: Growth differentiation factor 15.
CSF BIOMARKERS
CSF markers (core AD biomarkers), Aβ42 (or Aβ42/Aβ40 ratio), indicate Aβ plaque pathology; phosphorylated-tau (p-tau), an indication of tau phosphorylation; and total-tau (t-tau), a marker of neurodegeneration.[17] Moreover, the aging-dependent biomarkers GFAP, NFL, and GDF15 plasma levels are correlated with tau and cerebral Aβ disorders. Research on these biomarkers, in CSF or plasma in association with brain PET of amyloid and/or tau, distinguishes individuals at preclinical, mild cognitive impairment (MCI), and/or dementia stages, and predicts future cognitive decline in CU elderly people.
AMYLOID BETA (Aβ 42)
The distinctive characteristics of AD are the aberrant accumulation of the Aβ protein in certain areas of the brain, which is crucial for memory and cognition. The enzymes β and γ secretases cleave APP, a transmembrane protein, sequentially along its amyloidogenic route, and pathogenic Aβ is produced. The length of the resulting Aβ peptide, which can have any length between 37 and 49 amino acids, is determined by the location of γ-secretase cleavage. The most prevalent variants of Aβ are Aβ1–40, and Aβ1–42.[18] After that, these monomeric isoforms can group together to create larger soluble oligomers known as protofibrils, heterogeneous soluble oligomers that can diffuse throughout the brain, or insoluble fibrils that can group together even more to form Aβ plaques.[19]
Aβ42/40RATIO
Fully automated immunoassays are used to assess the Aβ42/40 ratio in CSF. When it comes to predicting amyloid positive in AD (D), in comparison to Aβ42, the Aβ42/40 ratio is a more precise and dependable biomarker.[20] This is because when only Aβ42 is considered, it may provide false-positive results since the Aβ42/40 ratio fixes interpatient heterogeneity in Aβ generation. The Aβ42/40 ratio effectively distinguishes between PET-positive and PET-negative individuals, equivalent to the pTau181/Aβ42 and tTau/Aβ42 ratios.[21]
PHOSPHORYLATED-TAU
Tau is extensively produced by neurons in the CNS, where it predominantly localizes to the axon rich microtubules to support intraneuronal transport and preserve the structural integrity of the neuron. Reduced levels of tau inside the somatodendritic compartment influence the activation of post-synaptic receptors. Numerous post-translational changes, including phosphorylation, methylation, acetylation, nitration, glycosylation, prolylisomerization, glycation, and ubiquitylation are applied to the tau protein.[22] Phosphorylated tau is an important biomarker for neurodegenerative illnesses, including AD. The phosphorylated tau, specifically p-tau217, p-tau181, and p-tau231, has a high degree of accuracy in distinguishing between AD and control groups.[23] Tau neurofibrillary tangles were strongly linked to cerebral amyloid-β plaques as they were with p-tau. p-tau as a biomarker presents significant prospects for early diagnosis of AD, follow-up, and possible treatment trials, particularly in blood-based tests.[24,25]
GFAP
GFAP is a transitional filament protein present in the astrocytic cytoskeleton. In AD patients, GFAP expression and concentrations are elevated in regions proximal to Aβ plaques and increases as tau accumulates in the entorhinal cortex.[26] Glial pathology is a key contributor to age-related neurodegenerative pathology and is found in the aging brain.[27] In pathological conditions, astrocytes exhibit various kinds of anatomical and physiological changes generally known as reactive astrocytes and express the protein GFAP.[28] Analyses of GFAP in serum and plasma have shown that it is elevated in a variety of neurological disorders. Plasma GFAP can detect abnormal CSF Aβ42/40 and CSF Aβ42/T-tau levels, indicating the presence of AD pathology in persons with MCI. In addition, it has been observed that plasma GFAP accurately predicts the eventual conversion to AD dementia.[29] A systematic review has indicated that GFAP is a feasible biomarker for AD, and that it may be a good choice for identifying AD in its early stages in peripheral blood. Hence, blood GFAP measures applied to clinical settings may speed up AD diagnosis and enhance treatment outcomes.
NEFL CHAIN
NEFL is a neuron-specific axonal cytoskeletal protein. The most prevalent subunit among the four subunits (light, medium, heavy, and alpha-internexin) is NEFL.[30] NEFL levels in the CSF are related to neuronal death and axonal degeneration. It is certainly possible that NEFL can detect neurodegeneration in AD patients before symptoms. Disruption of these brain cells causes cells to release NEFL into the blood, which eventually ends up in the plasma. Therefore, a rise in NEFL levels in the plasma may be a sign of increased brain cell injury.[31] Although NEFL is not exclusive to AD, it is a well-established biomarker for the condition. Since NEFL is released whenever there is damage to brain cells, there are other potential causes of that harm.[32] However, this protein may be an effective tool for monitoring and forecasting the course of a disease in an individual who has already received a diagnosis.
GDF15
GDF-15 (macrophage inhibitory cytokine-1) is a member of the transforming growth factor-β superfamily and is an anti-inflammatory, proapoptotic stress response cytokine.[33] It occurs in many tissues and organs and is typically more prevalent in cases of brain, liver, or heart damage.[34] GDF-15 has regulatory functions in inflammation and can be generated by microglial cells and lesioned neurons in CNS. Functional investigations suggest that GDF-15 has a role in Aβ clearance, signifying a link with the risk of neurodegenerative diseases. An increased risk of incident AD was linked to higher levels of GDF-15 in circulation.[35] Furthermore, in an older cohort study of people with cognitively normal and MCI, GDF15 has been associated with magnetic resonance imaging (MRI)-based AD score Alzheimer’s disease pattern similarity (AD-PS), indicating that it may be a biomarker for the progression of AD.[36]
TECHNIQUES FOR MEASUREMENT OF BIOMARKERS
The clinical diagnosis of AD is based on symptoms. The challenge is using biomarkers to detect AD in the preclinical stage and commence medication early. Now, AD clinical diagnoses are uncertain. Only a few nations have access to biomarkers, and newer treatments are emerging for early AD that aid in the definitive diagnosis.
FLUDEOXYGLUCOSE (FDG)-PET
FDG – PET [[18F] – 2–Fluoro – 2–deoxy-D-glucose – Positron Emission Tomography] imaging is considered useful for the early differential diagnosis of AD versus nonAD dementias.[37] In cases of MCI, [18F] FDG-PET imaging has been identified as an important diagnostic signal that supports the existence of AD pathology.[38] The primary energy source of the brain is glucose. It circulates in the blood and passes the blood-brain barrier. FDG is a synthetic derivative of glucose that functions like glucose up until it is phosphorylated. FDG that has been phosphorylated accumulates in tissue and cannot be further metabolized. FDG trapping rate is directly correlated with glucose metabolism. Hypometabolism or decreased regional FDG trapping is thought to indicate synaptic and neuronal damages.[39] The processes used by different sites to obtain FDG images might differ. After a fasting period of around 4 hrs, a fasting participant receives an intravenous injection of FDG and waits at least 30 min for the FDG to circulate before acquiring PET data for 10–30 min. The standardized uptake value (SUV) is typically computed using body mass (kg) and the administered dosage of FDG megabecquerel (MBq). Absolute glucose metabolism may also be estimated using an arterial input function. SUV ratios can be generated from a reference area, which is often a part of the body untouched by the disease progression, such as the cerebellar gray matter in AD.[40] The sensitivity and specificity of AD diagnosis varies by research in frontotemporal dementia and hypometabolic areas include the frontal and anterior temporal lobes, cingulate gyri, uncus, insula, basal ganglia, and medial thalamus [Figure 2].[41] Recurring the scan more frequently than once a year is not advised due to the radiation exposure involved. Since the scan exposes the patient to radiation, it is not advised to have it done more often than once a year.[42]
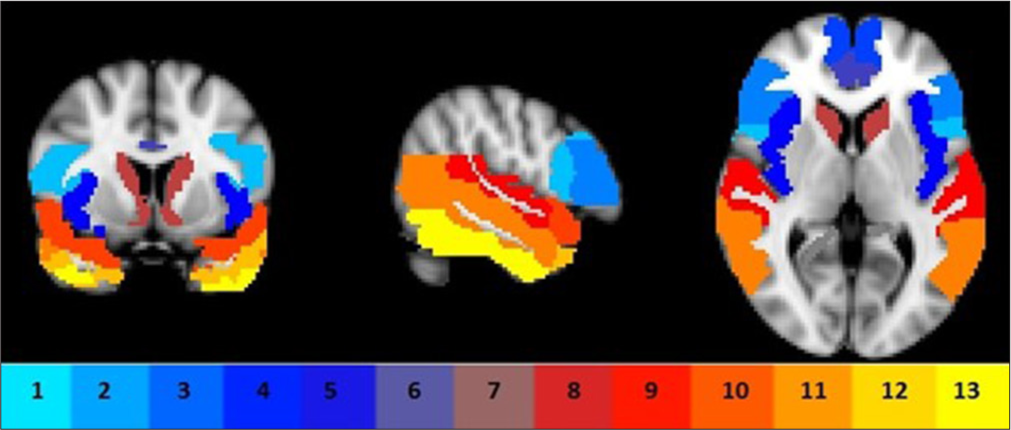
- Region of interests comprised frontal sub-regions (1–4), insula (5), anterior cingulate (6), precuneus (7), caudate (8), and temporal sub-regions (9, 15–17) bilaterally.
COMPUTED TOMOGRAPHY (CT) AND MRI
In dementia, CT and MRI constitute anatomic imaging. Both the Canters for Medicare and Medicaid Services and United States food and drug administration (USFDA) have authorized CT and MRI, which can identify tumors, vascular lesions, bleeding, and structural abnormalities. Compared to MRI, CT is more affordable and accessible. For a more thorough structural study and to assess tissue damage, cortical atrophy, and vascular disease – particularly microbleeds that are invisible on CT, – MRI is the best imaging technique. In addition, amyloid-related imaging abnormalities (ARIA) that may complicate anti-amyloid therapy can be evaluated by MRI.[43]
PLASMA AND CSF SAMPLING
Samples of CSF and blood were collected in ethylenediaminetetraacetic acid (EDTA)-plasma tubes, and they were centrifuged for 10 min (2000 g and + 4°C). Then, the plasma was aliquoted into 1.5 mL polypropylene tubes, with 1 mL of plasma in each tube, and kept cold (−80°C) for 30–60 min after collection. LP was used to obtain CSF, which was then processed and kept in polypropylene tubes at −80°C. However, LP is a somewhat intrusive technique, and it can be difficult to acquire CSF on a significant number of old, infirm people in the community especially on a regular basis.[44]
LP
CSF samples are generally collected through LP in clinical as well as research controls for measurement of biomarkers in AD.[45] The LP is preceded by an MRI or CT scan. To perform LP, follow these procedures: Examine your medication. Perform LP between 8 and 12 AM on a standard basis. It is possible to ask the patient to lie down or to sit. The L3/L4 or L4/L5 interspaces are used for the LP, as shown in [Figure 3].[46] Cleanse the skin using usual protocols. It is possible to give a local anesthetic to the skin or subcutaneous tissue. Make use of a thin needle (0.7 mm/22 gauge). Employ atraumatic technique and insert the needle parallel to the dura fiber with the bevel facing up. Discard the initial ½-1 mL of CSF. If there is bleeding from a puncture, more CSF may be discarded until it ceases to bleed. A fresh tube is used to obtain the CSF sample. Place the CSF sample in a non-adsorbing polypropylene tube. A standardized volume (10– 12 mL) is drawn into a single tube. After capping the tube, it is carefully mixed by rotating it several times. After LP, allow the patient to relax for half-hour to an hour. Without any delay, transfer the CSF sample to the nearby laboratory.
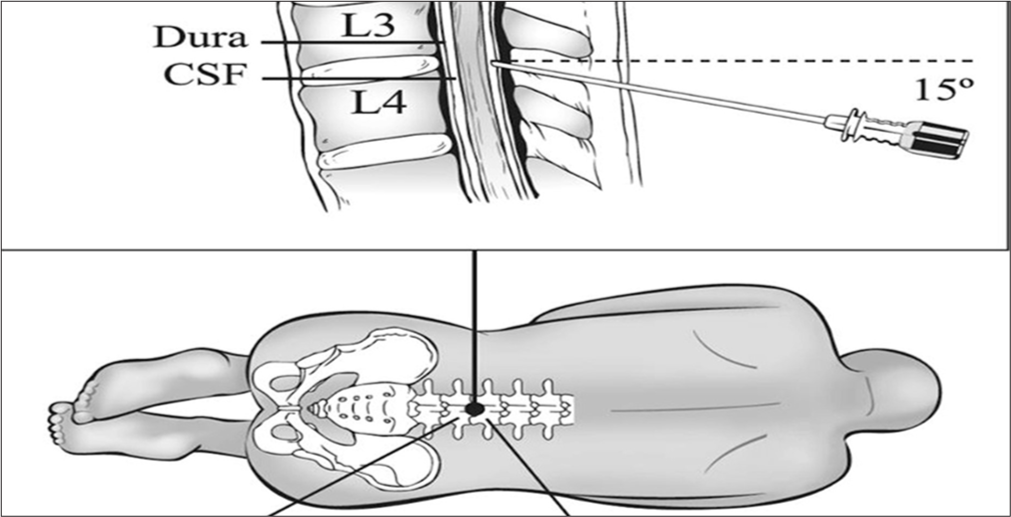
- Cerebrospinal fluid (CSF) samples collected from lumbar puncture between L3L4 or L4L5 interspaces.
SINGLE-MOLECULE ARRAY (SIMOA)
Quanterix’s SIMOA technology permits the determination to analyze the concentrations at the low pg/mL – fg/mL ranges, using similar reagents as standard enzyme-linked immunosorbent assay tests.[47] Analyte molecules bind to coated beads and are labeled with β-galactosidase. Then, the beads are distributed to a microarray, where each microwell is sized to hold a single bead. Subsequently, a substrate is added, resulting in a fluorescent product in the wells that hold a labeled bead.[48] The standard SIMOA procedure is shown in [Figure 4].[49]
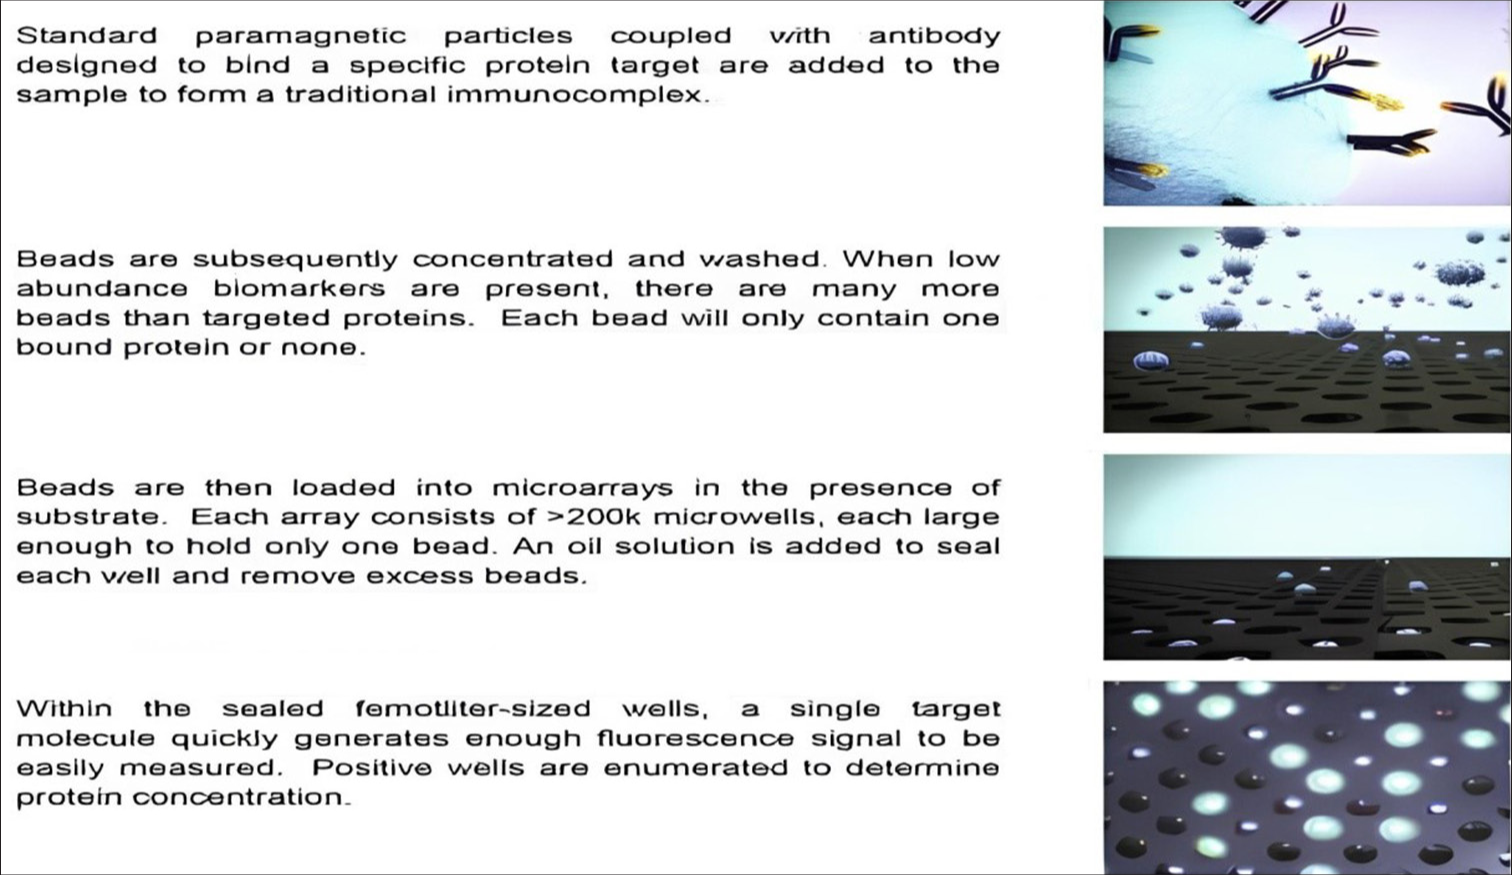
- Determination of protein concentrations by Quanterix’s single molecule array.
A STUDY FOUND THAT PROTEIN BIOMARKERS CAN PREDICT DEMENTIA 15 YEARS BEFORE DIAGNOSIS
A recent prospective study adopted proteomic analysis to predict incident dementia before clinical onset.[50] With over 52,000 participants and a follow-up period spanning 14.1 years, researchers from The University of Warwick in the United Kingdom and Fudan University in China have recognized 11 proteins that might be used as biomarkers to forecast dementia 15 years before diagnosis.
SUMMARY OF THE STUDY
In this case study, the possibility of using plasma proteomic patterns to forecast dementia in healthy persons was investigated.[51] A longitudinal study was carried out by the researchers and evaluated the cognitive function of a cohort of healthy adults over time through analyzing their plasma samples. To create a prediction model for early identification and management, they identified certain protein biomarkers linked to the onset of dementia.
COLLECTION OF SAMPLES
During 2007–2010, baseline blood samples have been obtained at 22 local testing centers across UK. Most of the samples were obtained at random from UKB participants at the baseline assessment; the remaining samples were collected from participants in the coronavirus disease-19 repeat-imaging experiment as well as participants of the UKB Pharma Plasma Proteome consortium over many visits.[52]
PARTICIPANT’S CHARACTERISTICS
The research enrolled 52,645 participants with no dementia at baseline and had a median age of 58. Of these participants, 53.9% were women, and 93.7% were European descent. Over a median follow-up of 14.1 years, 1417 (2.7%) incident instances of dementia were identified; 219 of these cases occurred within 5 years, 833 within 10 years, and 584 beyond 10 years. Of the 691 people with an AD diagnosis, 384 experienced episodes in a 10-year period, and 307 experienced episodes more than a 10-year period.
BLOOD PROTEOMICS
Samples are collected in EDTA tubes (2500 mg) and centrifuged for 10 min at 4°C to separate plasma. After that, the centrifuge was separated into aliquots and kept for as long as feasible at −80°C until it undergoes additional processing. The samples had been sent to Sweden’s Olink Analysis Service on dry ice, where they were reliably evaluated with the Olink Explore proximity extension assay (PEA), a technique that links DNA-encoded tags to protein-specific antibodies to translate protein information. It has been demonstrated that the method has excellent readout sensitivity and specificity (sub-pg/mL), allowing for high multiplex assays with wide dynamic range (∼9 log) and low resource consumption. In PEA, matching antibodies tagged with oligonucleotides will bind pairwise to their target antigens. The matching oligonucleotides are pushed closer together by antibody binding, and DNA polymerase is used to create, identify, amplify, and quantify the polymerase chain reaction target sequence.[53] One thousand four hundred and sixty-three distinctive proteins were identified over four panels, including cardiometabolic, inflammatory, neurology, and cancer proteins. For all Olink panels, the coefficients of variation across and within plates were <20% and 10%, respectively. The levels of protein were obtained by converting them into Normalized Protein Expression (NPX) values. NPX values are employed to ensure fair comparisons between samples. To adjust for variations in sample processing, the proteins in each sample are first measured, and the results are then divided by a control measurement. As a result, the data are more consistent and similar across samples, helping to “normalize” the data. The logarithm of these normalized readings is then used to determine the NPX values. The resulting conversion facilitates the interpretation and the statistical analysis of the data helps to more accurately depict the range of protein levels.
STUDY MODEL
The analysis of variables and differences across groups (incidence AD vs. Control) was examined using Chi-square tests and student’s t-tests for categorical and continuous variables, respectively [Table 2].[54] Demographic variables including age, sex, education level, and APOE ε4 alleles were considered as adjusting Model 1. Additional adjustments were made to Model 2 for systolic blood pressure, hypertension treatment, diabetes, smoking status, prevalence of cardiovascular disease (heart failure, stroke, atrial fibrillation, or coronary heart disease), total high density lipoprotein cholesterol, and body mass index.
| Model | Participants characteristics | Overall | Control | Incident AD | |
|---|---|---|---|---|---|
| n=52,645 | n=51,228 | n=691 | P-value | ||
| Model 1 | Age, years | 58 [50–64] | 58 [50–63] | 67 [63–68] | 3.79×10 |
| Sex (female) | 28,393 (53.9) | 27,706 (54.1) | 379 (54.8) | 0.717 | |
| Ethnicity (white) | 49,353 (937) | 47,985 (937) | 67 (96.5) | 0.003 | |
| Education years | 11 [10–15] | 11 [10–15] | 10[9–12] | 8.46×10 | |
| APOE 84 single-copy carriers | 13,610 (25.9) | 13,041 (25.5) | 308 (44.6) | 8.57×10 | |
| APOE 84 double-copies carriers | 1,474 (2.8) | 1,244 (2.4) | 160 (23.2) | ||
| Model 2 | Systolic BP, mmHg | 138 [126–152] | 138 [125–152] | 145 [132–159] | 9.08×10 |
| Hypertension treatment | 11,648 (22.1) | 11,078 (21.6) | 275 (39.8) | 2.84×10⁻³⁰ | |
| Diabetes | 2,979 (5.7) | 2,783 (5.4) | 94 (13.6) | 2.42×10 | |
| Current smoker | 6,562 (10.6) | 5,424 (10.6) | 60 (8.7) | 0.120 | |
| Atrial fibrillation | 1,140 (2.2) | 1,072 (2.1) | 26 (3.8) | 0.004 | |
| Coronary heart disease | 3,244 (6.2) | 3,004 (5.9) | 99 (14.3) | 2.43×10 | |
| Heart failure | 481 (0.9) | 457 (0.9) | 13 (1.9) | 0.012 | |
| Stroke | 936 (1.8) | 873 (1.7) | 24 (3.5) | 6.78×10 | |
| Peripheral artery disease | 1,191 (2.3) | 1,132 (2.2) | 21 (3.0) | 0.180 | |
| Total cholesterol, mmoll | 64 (9.6) | 5.6 [4.9–6.4] | 5.5 (4.6–6.4) | 0.006 | |
| HDL cholesterol, mmoll | [1.2–1.6] | 1.4 [1.2–1.6] | [1.2–1.6] | 0.856 | |
| BMI | 26.8 [24.2–29.9] | 26.8 [24.2–29.9] | 26.9 (24.2–29.8) | 0.787 | |
| Pairs matching time, S | 189 [149–247] | 189 [149–246] | 233 [173–330] | 2.09×10 | |
| Reaction time, ms | 543 444–617 | 540 [481–614] | 594 (529–685) | 7.83×101 | |
AD: Alzheimer’s disease, HDL: High-density lipoprotein, BMI: Body mass index, BP: Blood pressure, APOE: Apolipoprotein E
KEY STEPS INVOLVED IN PROTEIN IDENTIFICATION
First, Cox proportional hazard regression (statistical technique used for analyzing the survival time data) in model 1 and 2 was carried out to determine the correlations between each plasma proteins with the occurrence of AD and the hazard ratio (HR) was interpreted. An HR >1 indicates an increased hazard (risk), while an HR <1 shows a decreased hazard. An HR of one indicates that the predictor variable has no effect on the hazard.[55] Bonferroni adjustments were used to identify significant correlations (P < 0.05) among the 1463 proteins analyzed, accounting for the higher incidence of type I errors.[56] Enrichment analysis was carried out on essential proteins after interpreting Hazard regressions in Model 1 or Model 2 with Enrichr (a web-based tool for analyzing gene sets in the context of biological pathways).[57] Significant proteins were identified using hazard regressions for Model 1 and 2, and their relevance was rated using a light gradient boosting machine (LGBM) classifier.[58] A progressive forward selection strategy was used to add proteins to the LGBM classifier based on their importance rankings until optimal performance was achieved. Receiver operating characteristic analyses (used in epidemiological studies to determine accuracy of medical diagnostic tests (or systems) can differentiate between two patient states, usually referred to as “diseased” and “non-diseased”) were conducted to evaluate the precision of certain proteins in forecasting dementia, independently or in association with cognitive tests and demographic indicators.[59] A protein panel, or ProRS, was developed to predict future dementia more accurately. The study evaluated the generalizability and robustness of selected proteins and their predictive accuracy across different target populations and follow-up periods, including incident dementia and Alzheimer’s cases. Internal leave-one-region-out cross-validation, a technique used to evaluate a statistical model’s prediction abilities. leave one out cross-validation (LOOCV) is a subset of k-fold cross validation where k = n, the number of observations. LOOCV is applied in case of scarce data, since it maximizes the training set size.[60] LOOCV was employed to establish and evaluate predictive models, with hyper-parameter tuning and feature selection to reduce over fitting. Kaplan–Meier survival curves (an option used to measure the probability of surviving within a specified span)[61] and Cox proportional hazard models were used to assess the prognostic value of dichotomized protein concentrations adjusted for relevant covariates. The prognostic precision of identified proteins was evaluated to validate their performance. Temporal trajectories of plasma proteins preceding dementia diagnosis were depicted using a nested case–control study design, with locally biased scatterplot smoothing curves and trend tests used for observing dynamic changes over time. Overall, the study employed a rigorous methodology to identify and validate plasma proteins associated with dementia onset, providing insights into potential biomarkers for early detection and disease progression monitoring.
ANTIAMYLOID MONOCLONAL ANTIBODIES (MABS) FOR ALZHEIMER’S THERAPEUTICS
The first disease-modifying treatments for AD are anti-amyloid monoclonal antibodies (MABs), which delay the disease’s fundamental molecular processes and stop its clinical progression. Licenses have been granted in USA for the use of MABs such as aducanumab (Aduhelm®), lecanemab (Leqembi®), and donanemab to treat AD[62] [Table 3].[63]
| Drug name/brand name | Manufacturer | FDA status | Infusion frequency | Allowed anticoagulation or antiplatelet in trial |
|---|---|---|---|---|
| Aducanumab (Aduhelm) | Biogen | Approved 2021 (Accelerated Approval) |
Once every 4 weeks | Did not allow patients anticoagulation or antiplatelet therapy |
| Lecanemab (Leqembi) | Eisai | Granted approval on July 6, 2023 | Bi-weekly | Allowed patients with anticoagulation or antiplatelet therapy |
| Donanemab | Eli Lily | Approval delayed beyond Mar 2024 | Once every 4 weeks | - |
FDA: Food and drug administration
ADUCANUMAB
It has been suggested that AD canbe managed with aducanumab. The medication has been investigated on individuals with early-stage AD, including individuals with dementia or MCI brought on by the illness and those who show signs of amyloid plaque accumulation in the brain. Aducanumab is the first and only medication for AD that reduces Aβ plaques in the brain, and was authorized by the USFDA on June 07, 2021, through an accelerated approval process. The approval may rest on the findings of clinical trials showing aducanumab’s effectiveness in reducing Aβ plaques, a biomarker that can fairly predict the treatment benefit for patients with AD.[64] However, on January 31, 2024, Biogen officially declared its intention to terminate all development and commercialization of aducanumab (Aduhelm) for AD, more than 2 years after it received expedited clearance from the USFDA. Rather, Biogen will refocus its efforts with partners Eisai on lecanemab (Leqembi).[65]
LECANEMAB
Lecanemab, a humanized immunoglobulin G1 (IgG1) form of the murine antibody mAb158 monoclonal antibody, binds extensively to soluble amyloid-beta protofibrils[66,67] The pharmacological action of Lecanemab is shown in [Figure 5].[68] Soluble Aβ protofibrils are more toxic to neurons than insoluble fibrils as it causes neurotoxicity by interfering with the memory function.[69,70] Patients who inherit the apolipoprotein Eε4 (APOE4) gene, particularly those who are homozygotes, are more susceptible to ARIA. According to the acute urinary retention (AUR), APOE genotyping can help patients who are candidates for lecanemab and have more informed risk.[71]
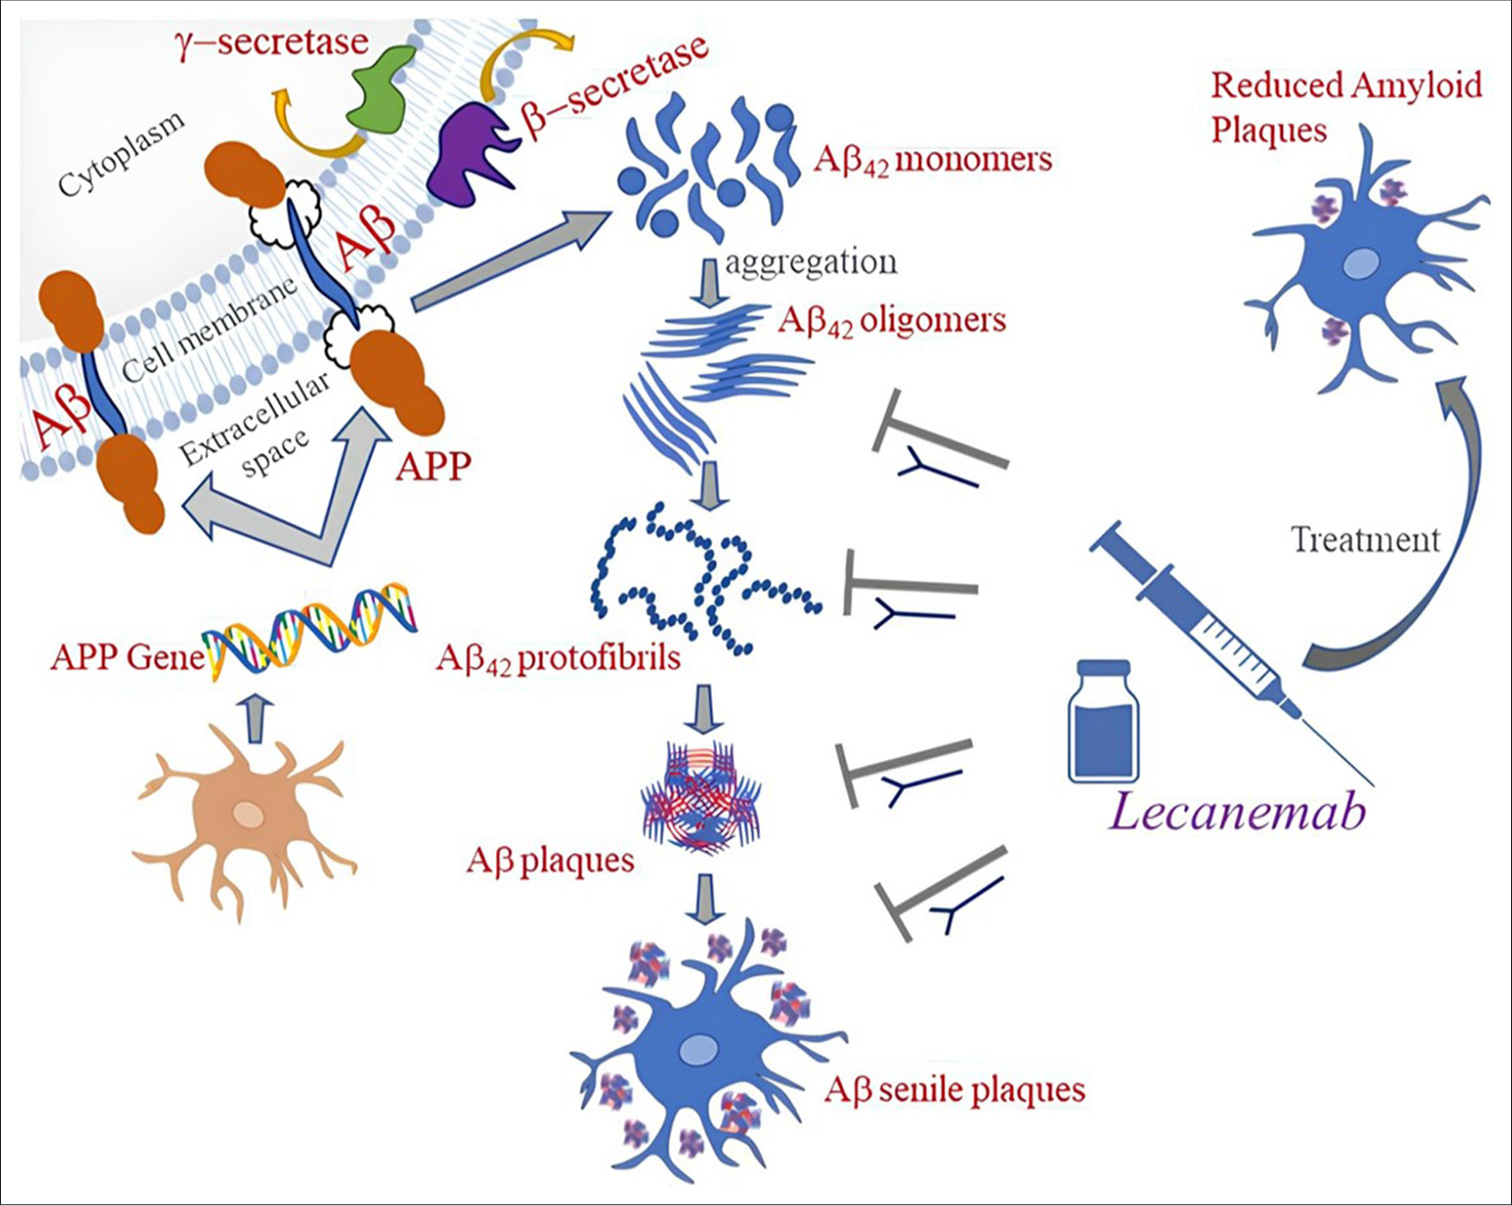
- Mechanism of action of lecanemab.
DONANEMAB
Donanemab is a humanized IgG1 antibody targeting N-terminal pyroglutamate amyloid β epitope observed only in established plaques.[72] Donanemab by Eli Lilly provides that antibody therapy for brain Aβ is administered as monthly infusion for 18 months.[73] Donanemab facilitates the removal of plaque by microglial-mediated phagocytosis by binding to the N-terminal condensed form of β-amyloid.[74]
CONCLUSION
The proteonomics study revealed that a wide range of plasma proteins are associated with an increased progression of incident AD. The study’s findings have direct implications for plasma GFAP, NEFL, and GDF15 as diagnostic biomarkers in the preclinical phases of dementia. Variations in GFAP, NEFL, and GDF15 can detect early dementia symptoms that occur more than 10 years before diagnosis. An early diagnosis is crucial for persons suffering from dementia because it ensures that they receive the necessary care and support. In recent years, disease-modifying treatments by anti-Aβ MABs with the potential of modifying the underlying pathophysiology of AD have been developed and are being assessed in clinical studies. New medications such as lecanemab and donanemab may also be able to delay the progression of AD. The FDA has authorized lecanemab as an immunotherapy for the management of early AD. It operates by focusing on the beta-amyloid protein to mitigate amyloid plaques. For a period, using biomarkers to start Alzheimer’s treatment early may assist and sustain everyday functioning. According to research findings, leading a healthy lifestyle can help shield your brain against cognitive deterioration. Maintaining a busy social, mental, and physical life that includes antioxidants can be helpful.
Ethical approval
Institutional Review Board approval is not required.
Declaration of patient consent
Patient’s consent was not required as there are no patients in this study.
Conflicts of interest
There are no conflicts of interest.
Use of artificial intelligence (AI)-assisted technology for manuscript preparation
The authors confirm that there was no use of artificial intelligence (AI)-assisted technology for assisting in the writing or editing of the manuscript and no images were manipulated using AI.
Financial support and sponsorship: Nil.
References
- Plasma Biomarkers for Prediction of Alzheimer's Disease Neuropathologic Change. Acta Neuropathol. 2023;146:13-29.
- [CrossRef] [PubMed] [Google Scholar]
- Biomarkers for Alzheimer's Disease in the Current State: A Narrative Review. Int J Mol Sci. 2022;23:4962.
- [CrossRef] [PubMed] [Google Scholar]
- Comprehensive Review on Alzheimer's Disease: Causes and Treatment. Molecules. 2020;25:5789.
- [CrossRef] [PubMed] [Google Scholar]
- Biomarkers and Surrogate Endpoints: Preferred Definitions and Conceptual Framework. Clin Pharmacol Ther. 2001;69:89-95.
- [CrossRef] [PubMed] [Google Scholar]
- Biomarkers for Neurodegenerative Diseases. Nat Med. 2021;27:954-63.
- [CrossRef] [PubMed] [Google Scholar]
- NIA-AA Research Framework: Toward a Biological Definition of Alzheimer's Disease. Alzheimers Dement. 2018;14:535-62.
- [CrossRef] [PubMed] [Google Scholar]
- GFAP as a Potential Biomarker for Alzheimer's Disease: A Systematic Review and Meta-Analysis. Cells. 2023;12:1309.
- [CrossRef] [PubMed] [Google Scholar]
- Molecular and Cellular Mechanisms Underlying the Pathogenesis of Alzheimer's Disease. Mol Neurodegeneration. 2020;15:40.
- [CrossRef] [PubMed] [Google Scholar]
- MiRNA-15b and miRNA-125b are Associated with Regional Aß-PET and FDG-PET Uptake in Cognitively Normal Individuals with Subjective Memory Complaints. Transl Psychiatry. 2021;11:78.
- [CrossRef] [PubMed] [Google Scholar]
- Pathogenesis of Alzheimer's Disease. Int J Mol Sci. 2022;24:107.
- [CrossRef] [PubMed] [Google Scholar]
- Systematic Review of miRNA as Biomarkers in Alzheimer's Disease. Mol Neurobiol. 2019;56:6156-67.
- [CrossRef] [PubMed] [Google Scholar]
- Biomarkers for Alzheimer's Disease-Preparing for a New Era of Disease-modifying Therapies. Mol Psychiatry. 2021;26:296-308.
- [CrossRef] [PubMed] [Google Scholar]
- Biomarkers for Alzheimer Disease: Classical and Novel Candidates' Review. Neuroscience. 2018;370:181-90.
- [CrossRef] [PubMed] [Google Scholar]
- Identification of Circulating miR-125b as a Potential Biomarker of Alzheimer's Disease in APP/PS1 Transgenic Mouse. J Alzheimers Dis. 2017;59:1449-58.
- [CrossRef] [PubMed] [Google Scholar]
- Neurobiological Mechanisms Involved in the Pathogenesis of Alzheimer's Disease Biological In: Diagnostic and Therapeutic Advances in Alzheimer's Disease. Berlin: Springer; 2019. p. :235-69.
- [CrossRef] [Google Scholar]
- Cerebrospinal Fluid Biomarkers for Alzheimer Disease and Subcortical Axonal Damage in 5,542 Clinical Samples. Alzheimers Res Ther. 2013;5:47.
- [CrossRef] [PubMed] [Google Scholar]
- Alzheimer's Disease Biomarkers Revisited from the Amyloid Cascade Hypothesis Standpoint. Front Neurosci. 2022;16:837390.
- [CrossRef] [PubMed] [Google Scholar]
- Cerebrospinal Fluid Tau and Amyloid-ß1-42 in Patients with Dementia. Brain. 2015;138:2716-31.
- [CrossRef] [PubMed] [Google Scholar]
- Cerebrospinal Fluid Amyloid-ß 42/40 Ratio in Clinical Setting of Memory Centers: A Multicentric Study. Alzheimers Res Ther. 2015;7:30.
- [CrossRef] [PubMed] [Google Scholar]
- The Cerebrospinal Fluid Biomarker Ratio Aß42/40 Identifies Amyloid Positron Emission Tomography Positivity Better than Aß42 Alone in a Heterogeneous Memory Clinic Cohort. Alzheimers Res Ther. 2022;14:60.
- [CrossRef] [PubMed] [Google Scholar]
- Tau as a Biomarker of Neurodegeneration. Int J Mol Sci. 2022;23:7307.
- [CrossRef] [PubMed] [Google Scholar]
- Plasma Phospho-tau in Alzheimer's Disease: Towards Diagnostic and Therapeutic Trial Applications. Mol Neurodegener. 2023;18:18.
- [CrossRef] [PubMed] [Google Scholar]
- Quantification of Plasma Phosphorylated Tau to Use as a Biomarker for Brain Alzheimer Pathology: Pilot Case-control Studies Including Patients with Alzheimer's Disease and Down Syndrome. Mol Neurodegener. 2017;12:63.
- [CrossRef] [PubMed] [Google Scholar]
- Is Phosphorylated Tau a Good Biomarker of Synapse Pathology in Alzheimer's Disease? Brain Commun. 2023;5:fcad142.
- [CrossRef] [PubMed] [Google Scholar]
- Astrocyte Phenotype in Relation to Alzheimer-type Pathology in the Ageing Brain. Neurobiol Aging. 2010;31:578-90.
- [CrossRef] [PubMed] [Google Scholar]
- Biological Agents and the Aging Brain: Glial Inflammation and Neurotoxic Signaling. Front Aging. 2023;4:1244149.
- [CrossRef] [PubMed] [Google Scholar]
- Redefining the Concept of Reactive Astrocytes as Cells that Remain within their Unique Domains upon Reaction to Injury. Proc Natl Acad Sci U S A. 2006;103:17513-8.
- [CrossRef] [PubMed] [Google Scholar]
- Plasma Glial Fibrillary Acidic Protein Detects Alzheimer Pathology and Predicts Future Conversion to Alzheimer Dementia in Patients with Mild Cognitive Impairment. Alzheimers Res Ther. 2021;13:68.
- [CrossRef] [PubMed] [Google Scholar]
- Role of Neurofilament Light Chain as a Potential Biomarker for Alzheimer's Disease: A Correlative Meta-Analysis. Front Aging Neurosci. 2019;11:254.
- [CrossRef] [PubMed] [Google Scholar]
- Alzheimer's Disease Neuroimaging Initiative. Association of Cerebrospinal Fluid Neurofilament Light Concentration with Alzheimer Disease Progression. JAMA Neurol. 2016;73:60-7.
- [CrossRef] [PubMed] [Google Scholar]
- Utility of Plasma Neurofilament Light and Total Tau for Clinical Trials in Alzheimer's Disease. Alzheimers Dement (Amst). 2020;12:e12099.
- [CrossRef] [PubMed] [Google Scholar]
- Growth/Differentiation Factor-15 (GDF-15): From Biomarker to Novel Targetable Immune Checkpoint. Front Immunol. 2020;11:951.
- [CrossRef] [PubMed] [Google Scholar]
- Growth Differentiation Factor-15 and White Matter Hyperintensities in Cognitive Impairment and Dementia. Medicine (Baltimore). 2016;95:e4566.
- [CrossRef] [PubMed] [Google Scholar]
- Growth Differentiation Factor 15 is Associated with Alzheimer's Disease Risk. Front Genet. 2021;12:700371.
- [CrossRef] [PubMed] [Google Scholar]
- GDF15 and its Association with Cognitive Performance Over Time in a Longitudinal Study of Middle-Aged Urban Adults. Brain Behav Immun. 2023;108:340-9.
- [CrossRef] [PubMed] [Google Scholar]
- Sensitivity and Specificity of Diagnostic Accuracy in Alzheimer's Disease: A Synthesis of Existing Evidence. Am J Alzheimers Dis Other Demen. 2013;28:337-47.
- [CrossRef] [PubMed] [Google Scholar]
- Brain Metabolic Maps in Mild Cognitive Impairment Predict Heterogeneity of Progression to Dementia. Neuroimage Clin. 2014;7:187-94.
- [CrossRef] [PubMed] [Google Scholar]
- Resting-state Brain Glucose Utilization as Measured by PET is Directly Related to Regional Synaptophysin Levels: A Study in Baboons. Neuroimage. 2003;20:1894-8.
- [CrossRef] [PubMed] [Google Scholar]
- Imaging Biomarkers in Neurodegeneration: Current and Future Practices. Alzheimers Res Ther. 2020;12:4.
- [CrossRef] [PubMed] [Google Scholar]
- Using Simultaneous PET/MRI to Compare the Accuracy of Diagnosing Frontotemporal Dementia by Arterial Spin Labelling MRI and FDG-PET. Neuroimage Clin. 2017;17:405-14.
- [CrossRef] [PubMed] [Google Scholar]
- Comparative Examination of the Pons and Corpus Callosum as Reference Regions for Quantitative Evaluation in Positron Emission Tomography Imaging for Alzheimer's Disease using 11C-Pittsburgh Compound-B. Ann Nucl Med. 2023;37:410-8.
- [CrossRef] [PubMed] [Google Scholar]
- Proteome-basedplasma Biomarkers for Alzheimer's Disease. Brain. 2006;129:3042-50.
- [CrossRef] [PubMed] [Google Scholar]
- Consensus Guidelines for Lumbar Puncture in Patients with Neurological Diseases. Alzheimers Dement (Amst). 2017;8:111-26.
- [CrossRef] [PubMed] [Google Scholar]
- Lumbar Puncture Increases Alzheimer's Disease Biomarker Levels in Cerebrospinal Fluid of Rhesus Monkeys. iScience. 2024;27:109436.
- [CrossRef] [PubMed] [Google Scholar]
- Single-molecule Enzyme-linked Immunosorbent Assay Detects Serum Proteins at Subfemtomolar Concentrations. Nat Biotechnol. 2010;28:595.
- [CrossRef] [PubMed] [Google Scholar]
- Challenges in Biomarker Analysis: SiMoA (Single Molecule Array) Makes the Tiny but Significant Difference. 2013. Celerion, White Paper. Available from: file:///c:/users/user/downloads/cel_challenges-in-biomarker-analysis_-simoa_wp_f.pdf
- [Google Scholar]
- Emerging Technologies to Increase Ligand Binding Assay Sensitivity. AAPS J. 2015;17:93-101.
- [CrossRef] [PubMed] [Google Scholar]
- Large-scale Plasma Proteomic Analysis Identifies Proteins and Pathways Associated with Dementia Risk. Nat Aging. 2021;1:473-89.
- [CrossRef] [PubMed] [Google Scholar]
- Plasma Tau, Neurofilament Light Chain and Amyloid-ß Levels and Risk of Dementia; a Population-Based Cohort Study. Brain. 2020;143:1220-32.
- [CrossRef] [PubMed] [Google Scholar]
- Plasma Proteomic Associations with Genetics and Health in the UK Biobank. Nature. 2023;622:329-38.
- [CrossRef] [PubMed] [Google Scholar]
- A Two-step Strategy for Identification of Plasma Protein Biomarkers for Endometrial and Ovarian Cancer. Clin Proteomics. 2018;15:38.
- [CrossRef] [PubMed] [Google Scholar]
- Plasma Proteomic Profiles Predict Future Dementia in Healthy Adults. Nat Aging. 2024;4:247-60.
- [CrossRef] [PubMed] [Google Scholar]
- A Practical Guide to Methods Controlling False Discoveries in Computational Biology. Genome Biol. 2019;20:118.
- [CrossRef] [PubMed] [Google Scholar]
- When to Use the Bonferroni Correction. Ophthalmic Physiol Opt. 2014;34:502-8.
- [CrossRef] [PubMed] [Google Scholar]
- Enrichr: Interactive and Collaborative HTML5 Gene List Enrichment Analysis Tool. BMC Bioinformatics. 2013;14:128.
- [CrossRef] [PubMed] [Google Scholar]
- Improved Prediction of Protein-Protein Interaction using a Hybrid of Functional-link Siamese Neural Network and Gradient Boosting Machines. Brief Bioinform. 2021;22:bbab255.
- [CrossRef] [PubMed] [Google Scholar]
- Receiver Operating Characteristic (ROC) Curve Analysis for Medical Diagnostic Test Evaluation. Caspian J Intern Med. 2013;4:627-35.
- [Google Scholar]
- Efficient Strategies for Leave-one-out Cross Validation for Genomic Best Linear Unbiased Prediction. J Anim Sci Biotechnol. 2017;8:38.
- [CrossRef] [PubMed] [Google Scholar]
- Understanding Survival Analysis: Kaplan-Meier Estimate. Int J Ayurveda Res. 2010;1:274-8.
- [CrossRef] [PubMed] [Google Scholar]
- Anti-Amyloid Monoclonal Antibodies for the Treatment of Alzheimer's Disease. BioDrugs. 2024;38:5-22.
- [CrossRef] [PubMed] [Google Scholar]
- A Plaque-specific Antibody Clears Existing ß-amyloid Plaques in Alzheimer's Disease Mice. Neuron. 2012;76:908-20.
- [CrossRef] [PubMed] [Google Scholar]
- The Accelerated Approval of Aducanumab for Treatment of Patients with Alzheimer Disease. JAMA Intern Med. 2021;181:1281.
- [CrossRef] [PubMed] [Google Scholar]
- Aducanumab: A New Hope in Alzheimer's Disease. Health Sci Rev. 2022;4:100039.
- [CrossRef] [Google Scholar]
- An Amyloid-beta Protofibril-selective Antibody Prevents Amyloid Formation in a Mouse Model of Alzheimer's Disease. Neurobiol Dis. 2009;36:425-34.
- [CrossRef] [PubMed] [Google Scholar]
- Lecanemab in Early Alzheimer's Disease. N Engl J Med. 2023;388:9-21.
- [CrossRef] [PubMed] [Google Scholar]
- Monograph on the Internet Format: Monoclonal Antibodies for Alzheimer's Resources [Monograph on the Internet] 2023. United States: American Academy of Neurology; https://www.aan.com/tools-resources/monoclonal-antibodies-alzheimers [Last accessed on ??? Jul 26]
- [Google Scholar]
- Novel Anti-amyloid-beta (Aß) Monoclonal Antibody Lecanemab for Alzheimer's Disease: A Systematic Review. Int J Immunopathol Pharmacol. 2023;37:3946320231209839.
- [CrossRef] [PubMed] [Google Scholar]
- The Murine Version of BAN2401 (mAb158) Selectively Reduces Amyloid-ß Protofibrils in Brain and Cerebrospinal Fluid of tg-ArcSwe Mice. J Alzheimers Dis. 2015;43:575-88.
- [CrossRef] [PubMed] [Google Scholar]
- Lecanemab: Appropriate Use Recommendations. J Prev Alzheimer's Dis. 2023;10:362-77.
- [CrossRef] [PubMed] [Google Scholar]
- Proximity Extension Assay in Combination with Next-Generation Sequencing for High-throughput Proteome-wide Analysis. Mol Cell Proteomics. 2021;20:100168.
- [CrossRef] [PubMed] [Google Scholar]
- Donanemab Leads to Modest Slowing of Alzheimer's Progression, Study Finds. BMJ. 2023;382:1659.
- [CrossRef] [PubMed] [Google Scholar]
- Treatment of Alzheimer's Disease in the New Era of Monoclonal Antibodies Against Cerebral Amyloid-ß: Pharmacological Prescription and Knowledge in Argentina. J Alzheimers Dis Rep. 2024;8:737-46.
- [CrossRef] [PubMed] [Google Scholar]