Translate this page into:
Factors Influencing the Perception and its Impact on Self-rated Health: A Cross-sectional Survey
 Pharm D, Bogireddy Sahithi1Pharm D, Hindustan Abdul Ahad1PhD, Bandaru Pavan Kumar1Pharm D, Vadde Madhusudhan1Pharm D

*Corresponding author: Lami Singh, Department of Pharmacy Practice, Raghavendra Institute of Pharmaceutical Education and Research, Anantapur, Andhra Pradesh, India. lamisingh594@gmail.com
-
Received: ,
Accepted: ,
How to cite this article: Singh L, Sahithi B, Ahad HA, Kumar BP, Madhusudhan V. Factors influencing the perception and its impact on self-rated health: A cross-sectional survey. Glob J Med Pharm Biomed Update 2023;18:21.
Abstract
Objectives:
A cross-sectional survey was made on self-rated health, which is a simple and easy-to-administer measure of general health. It is a valid and reliable measure among those without cognitive impairment. Initially, it replaced clinical assessments in survey research and clinical settings.
Materials and Methods:
This study was a cross-sectional survey and the study was conducted in a community-based online survey of 6-month duration. Psychologically ill patients, pregnant women, and pediatrics were excluded from this study. The sample size was set to be >800, and the collected data were 806. The data was procured from every willing individual in the age group of 18-60 years old. To identify the similarity and variances in their responses, they were correlated with the health rating of the responders. The physicians at RDT Hospital, Bathalapalli, Anantapur, Andhra Pradesh Prepared and validated the data collection form.
Results:
This study was evaluated to check the impact of health literacy on one’s health. All the factors were included and taken into consideration while framing the questionnaire. The parameters and the respondent’s answers were compared and correlated they were assessed by two-tailed test and significantly correlated using Pearson’s correlation. The self-rating of the health of the responders was found to be 47%. The major factors affecting health are age, gender, body mass index (BMI), occupation, weight profile, work profile, surrounding hygiene, quality of life, physical activity, eating habits, regular sleep cycle, sleep quality, stress factor, psychological and mental health, comorbidities, side effects, nutritional supplements, self-medication or doctor’s prescription, and literacy score. Respondent’s physical activities were collected and found to be 89.7% negative and statistically significant. The BMI of the responders was classified into four categories: Underweight (16.7%), normal (51.86%), overweight (20.09%), and obese (7.94%). It was found to be negatively significant and two-tailed correlated.
Conclusion:
The study has now provided evidence on what factors influence an individual’s health self-rating and how these factors correlate to influence each other on the same platform.
Keywords
Clinical
Correlation
Health
Self-rated
Tool

INTRODUCTION
Self-rated health (SRH) is a simple and easy-to-administer measure of general health. It is a valid and reliable measure among those without cognitive impairment. Initially, it replaced clinical assessments in survey research.[1-3] It is commonly used in psychological research, clinical settings, and general population surveys.[4] SRH is typically measured as a single item, the most common wording of which is “In general, how would you say your health is?”, with the response items: “excellent,” “very good,” “good,” “fair,” or “poor.” Early studies using SRH involved assessing the relationship between SRH and sociodemographic, physical health, and psychosocial variables. Additional uses of SRH involve investigating relationships between health constructs, sociodemographic, physical, and psychosocial variables, clarifying measurement issues, attempting to explain health and illness behavior, or describing populations’ health. SRH was found to be at least moderately associated with physicians’ assessments of health.[5,6]
SRH allows respondents to prioritize and evaluate different aspects of their health, maximizing the measure’s sensitivity to respondents’ views of health. SRH’s somewhat abstract nature also allows researchers to examine the cognitive processes involved in evaluating self-health.[3,7,8]
The purpose of this study was to evaluate the variables affecting the participants’ assessments of their health. Recent research has shown that SRH is essential for diagnosing and treating disorders such as cancer, obesity, diabetes, and hypertension. It is a useful assessment tool for clinicians who can use it to manage the health conditions of their patients with an accurate understanding and assessment of the health parameters, as well as the health-conscious population, which includes people with demanding lifestyles, high levels of stress, and demanding work schedules. SRH is thus employed as a technique to more accurately assess and comprehend health to enhance health status, health literacy, and the impact of lifestyle determinants. Recent years, it has shown to be a useful and significant new tool for health assessment.
A complex relationship exists between SRH and health-related behaviors. Health-related behaviors included in SRH studies often include smoking status, dietary assessments, physical activity, body mass index (BMI) or presence of obesity, and alcohol activity.[9] Often, these health behaviors are included as covariates rather than explanations or outcome variables.[10-12] Likewise, health-related behaviors have been used as control variables in studies exploring SRH and mortality. Health behaviors have been shown to mediate the relationship between SRH and mortality and this effect often differs by gender and/or duration of effect. Other studies, however, have only seen a fairly weak mediating influence of health behaviors on SRH and mortality.[13] Some studies have found only weak or irrelevant associations with SRH.[14,15] There have been contradictory findings concerning SRH and all smoking, alcohol-related behaviors, and dietary behaviors.[16]
The study used a feasible and convenient sampling method to assess knowledge and factors among adults and the elderly.[16]
MATERIAL AND METHODS
Data source
The data were obtained from the eligible candidates for the study criteria, which included the age group of 18– 70 years).[17] The major factors such as age, gender, BMI, occupation, weight profile, work profile, surrounding hygiene, quality of life, physical activity, eating habits, regular sleep cycle, sleep quality, stress factors, comorbidities, side effects, nutritional supplements, self-medication or doctor’s prescription, and literacy score were taken into consideration and accounted for in this study to estimate the correlation and other parameters affecting the health of the participants in an estimated population.[13,18,19]
Each participant’s BMI was manually determined after the survey. The survey questionnaire, which was created and calculated using the BMI formula, contained the necessary information for BMI, such as height and weight. The online survey form was issued to every age group with the idea that it included three categories, namely, employed, jobless, and student. The work profile was constructed generally with the age group in the survey (18–70 years) in mind. According to the final poll findings, 72% of students of various age groups took part.
Participants
The inclusion criteria for the study participants were people aged 18–70 who were willing to participate in the study.[20] The study included and considered all genders with good health or any chronic or acute disease with any comorbidity.[21-23] On the other hand, pregnant women, pediatrics, and psychologically ill patients were excluded from the study as they were considered to be incompetent to rate their health.[24-26] The collected data were refined, sorted, and analyzed using SPSS software, with correlation performed to determine the relationship between the responses and their health rating.[27]
Statistical analysis
The data were obtained and analyzed using the SPSS software, and a correlation was performed. Two types of correlation were checked: Spearman and Pearson’s. Two algorithms are typically employed to filter, refine, and form the results to ensure the correctness of the data from the survey that was conducted. The survey findings were produced using SPSS software and Pearson’s and Spearman’s correlations. The direction of the relationship between two variables can be determined using Pearson’s correlation, which assesses linear correlation. While Spearman correlation uses the monotonic function to quantify the monotonic variable and the relationship between two variables. The values (output) were acquired after the data had been gathered, cleaned, and analyzed using the SPSS software and various correlations. These values were subsequently contrasted with those discovered from the participants’ responses and the assessment of their health.[28-30]
[Table 1] demonstrates the values of the correlation obtained as well as the type of correlation (positive or negative).[31,32]
| Pearson’s correlation | Health rating how do you rate your health from 1 to 5? | |
|---|---|---|
| Other factors correlation | Spearman’s/Pearson’s correlation value | Significance value |
| Age | −0.81*a | 0.022 |
| Gender | 0.167**b | - |
| Body mass index | −0.95** | 0.007 |
| Occupation | 0.94** | 0.008 |
| Weight profile | −1.67**b | - |
| Work profile | −0.76*a | 0.31 |
| Surrounding hygiene | 0.181**b | - |
| Quality of life | −0.91**a | 0.009 |
| Precautions to be taken to prevent yourself from infectious diseases | −0.71*b | 0.44 |
| Physical activity | −1.72**b | - |
| Energy after a full working day? | 0.198**b | - |
| Consumption of a fatty diet or junk food | −0.94**a | 0.008 |
| Eating meals on time | 0.36*b | 0.309 |
| Regular sleep duration | 0.87* | 0.14 |
| Sleep quality | 0.232*a | - |
The above factors are all found to be significantly correlated (two-tailed). aSpearman’s correlation, bPearson’s Correlation, *Significant, **Highly significant
Parameter estimation
The main estimation parameter in the study was the correlation of the health rating with other factors affecting health. There was a correlation seen between the factors as well as the health rating, which thus supports the influence of the factors on the self- or individual-rated health of a person.[33]
RESULTS AND DISCUSSION
The study examined the responses obtained from the participants and a correlation was determined to exist between the factors influencing their daily patterns of living as well as the ratings of their health. This study was evaluated to check the impact of health literacy on one’s health. Our study consisted of 47 questions that were divided into seven different sections, the factors on which the self-rating was found to be dependent. The questionnaire included and took into account sociodemographic and economic details, the work profile, the self-health rating question, health literacy and physical activity, dietary factors, sleeping patterns, stress factors, comorbidities, additional nutrition, medication adherence, and self and doctor’s prescriptions. With a keen assessment of the responses and the result, we evaluated the knowledge of health among the participants and found that not all the answers were correctly answered in the “Health Literacy” sections.[34]
The parameters and the respondent’s answers were compared and correlated, and they were found to be two-tailed and significantly correlated using Pearson’s correlation.
A few parameters were not correlated, whereas more than 22 factors were found to be correlated. A few factors were not found to be significant or correlated with the health rating questionnaire. These were found to be bizarre questions with no or little correlation.
Most of the responders did not correctly answer the questions in the literacy knowledge part, which was the reason for the lack of or nil correlation.
In our study, with a total population or sample size of 806, the gender classification was done and found to be: Females (423) and males (383). The age had a negative correlation value (−0.81*). The self-rating of the health of the responders was classified into five different ranges [Table 2] and demographic features [Table 3] were expressed.
| Ranges | Description | Number of participants | Percent of participants |
|---|---|---|---|
| 1 | Extremely poor | 6 | 0.74 |
| 2 | Fair or average | 15 | 1.86 |
| 3 | Good | 193 | 23.94 |
| 4 | Very good | 386 | 47.89 |
| 5 | Excellent | 208 | 25.80 |
| Characteristics | Number | Percentage |
|---|---|---|
| Age | ||
| 18–34 | 723 | 89.7 |
| 35–50 | 62 | 7.69 |
| 51–69 | 12 | 1.48 |
| Sex | ||
| Female | 423 | 52.4 |
| Male | 475 | 58.9 |
| Body mass index | ||
| Underweight | 135 | 16.7 |
| Normal | 418 | 51.86 |
| Overweight | 162 | 20.09 |
| Obese (class I, II, III) | 64 | 7.94 |
| Employment status | ||
| Unemployed | 42 | 5.21 |
| Employed | 177 | 21.9 |
| Student | 587 | 72.8 |
| Work profile | ||
| Working | 133 | 16.50 |
| Students | 495 | 6.07 |
| Jobless | 5 | 0.62 |
| Income | ||
| <1 Lakhs | 92 | 11.41 |
| 1–3 Lakhs | 32 | 3.97 |
| 3–5 Lakhs | 34 | 4.21 |
| >5 Lakhs | 29 | 3.59 |
| Location | ||
| Slum | 4 | 0.49 |
| Rural | 241 | 29.9 |
| Semi -/Urban | 342 | 42.4 |
| Urban | 109 | 13.5 |
| Smart city | 110 | 13.6 |
| Smoking | ||
| No | 760 | 94.2 |
| Occasionally | 16 | 1.98 |
| Used to in the past | 6 | 0.74 |
| Yes | 24 | 2.97 |
| Drinking | ||
| No | 715 | 88.7 |
| Occasionally | 50 | 6.20 |
| Used to in the past | 7 | 0.86 |
| Yes | 37 | 4.21 |
Various responses from the responders are represented in [Figures 1 and 2].
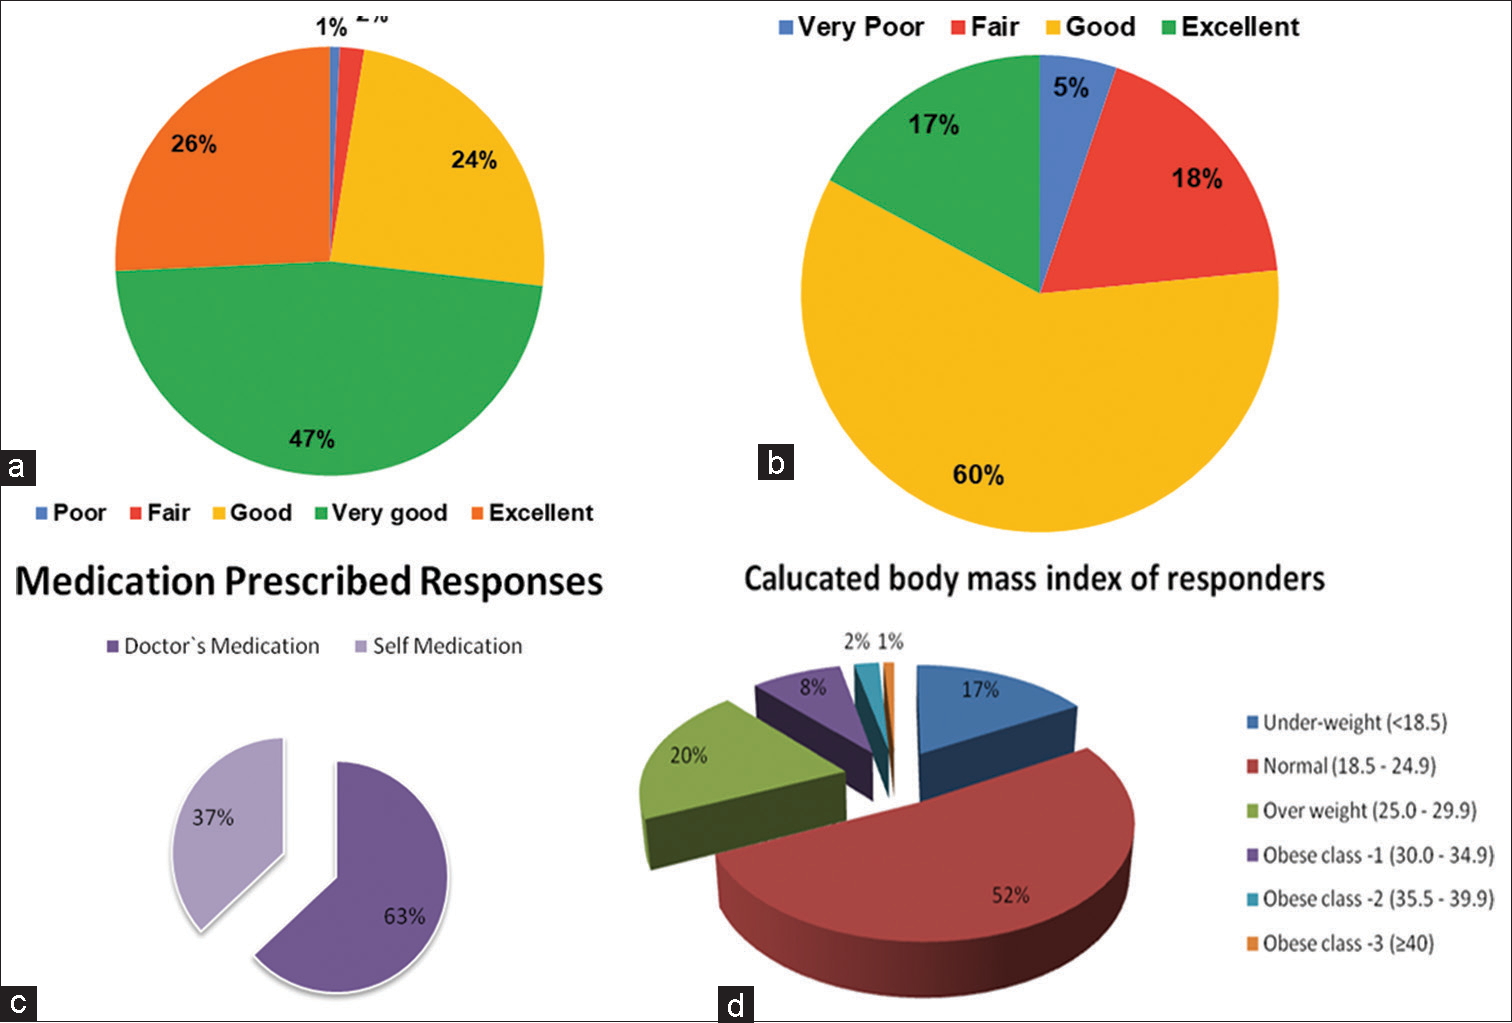
- Graphical representation of (a) health response rating, (b) sleep quality, (c) self-medication doctors’recommendation, and (d) weight and height relationship-body mass index of responders.
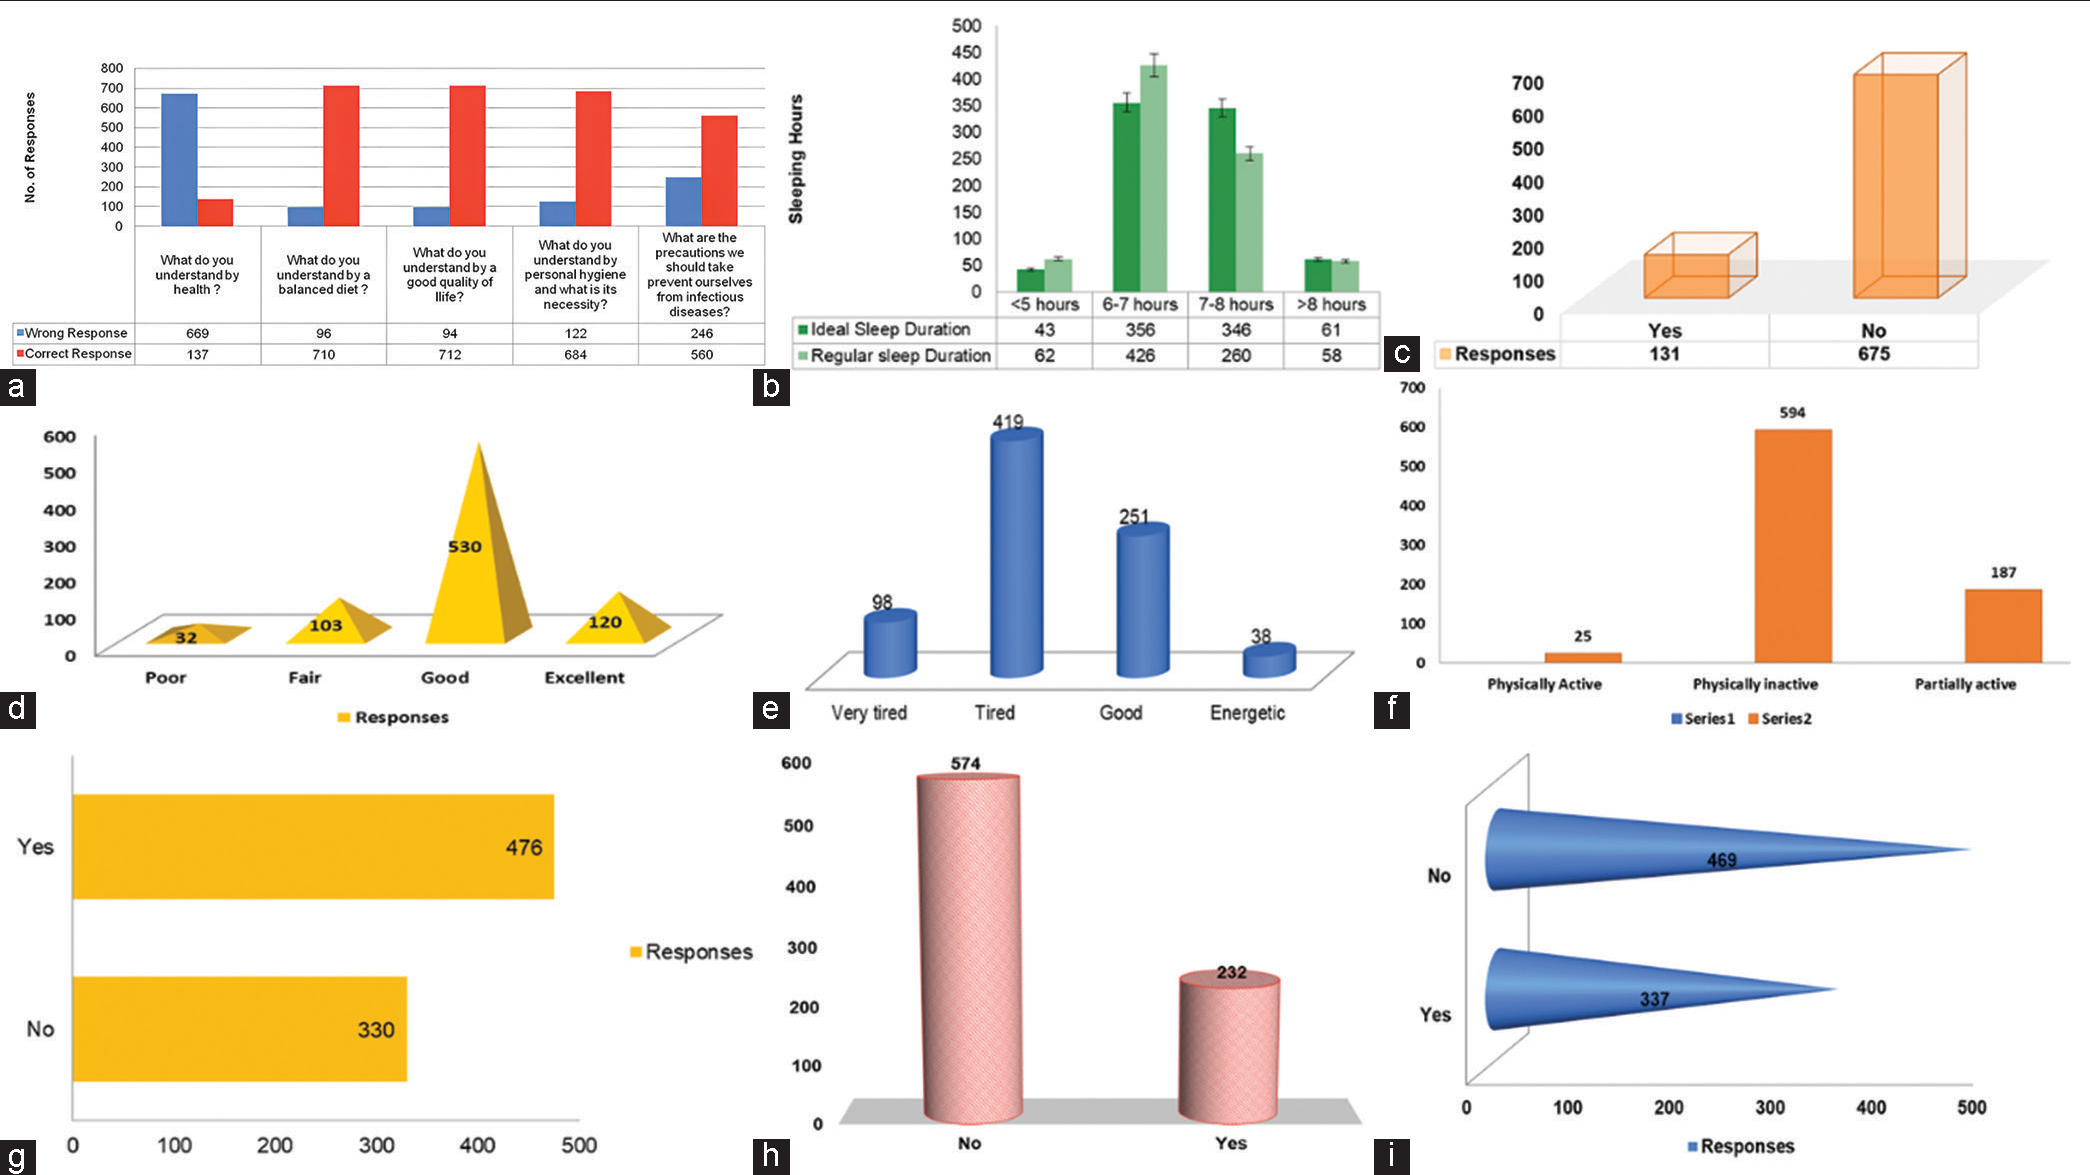
- Graphical representation of (a) health literacy, (b) perceived ideal versus. sleep duration, (c) side effects due to any medications, (d) surrounding hygiene, (e) stress and exhaustion of whole day, (f) physical activity, (g) perceived stress/tension/anxiety, (h) medications prescribed for any illness, and (i) medication adherence of the responses from the responders.
CONCLUSION
The study has now provided evidence on what factors influence an individual’s self-rating and how these factors correlate to influence each other on the same platform. Self-rating health is one of the most reliable, responsive, valid, and accurate tools for the clinical assessment of any underlying disease and it has also proven to be a reliable tool for knowing the patient’s health condition and even his or her slightest discomfort. Promoting good healthcare practices can bring drastic changes to the health facilities of a society, which can improve health and also increase the overall global impact on the health of the society and its population.
Declaration of patient consent
Patient’s consent not required as there are no patients in this study.
Conflicts of interest
There are no conflicts of interest.
Financial support and sponsorship
Nil.
References
- Refining caregiver vulnerability for clinical practice: Determinants of self-rated health in spousal dementia caregivers. BMC Geriatr. 2019;19:18.
- [CrossRef] [PubMed] [Google Scholar]
- Predictors of self-reported health among the elderly in Ghana: A cross sectional study. BMC Geriatr. 2017;17:171.
- [CrossRef] [PubMed] [Google Scholar]
- Self-rated health, subjective social status in school and socioeconomic status in adolescents: A cross-sectional study. BMC Public Health. 2019;19:785.
- [CrossRef] [PubMed] [Google Scholar]
- Screening for depression in the general population with the center for epidemiologic studies depression (CES-D): A systematic review with meta-analysis. PLoS One. 2016;11:e0155431.
- [CrossRef] [PubMed] [Google Scholar]
- Subjective life expectancy and actual mortality: Results of a 10-year panel study among older workers. Eur J Ageing. 2018;15:155-64.
- [CrossRef] [PubMed] [Google Scholar]
- The pathways from perceived discrimination to self-rated health among the Chinese diaspora during the COVID-19 pandemic: Investigation of the roles of depression, anxiety, and social support. Int J Equity Health. 2021;20:192.
- [CrossRef] [PubMed] [Google Scholar]
- Scoping review: Influence of cisgender male and female genders on health literacy of the elderly people. Health Soc Care Community. 2022;30:e550-64.
- [CrossRef] [PubMed] [Google Scholar]
- Tooth loss and associated self-rated health and psychological and subjective wellbeing among community-dwelling older adults: A cross-sectional study in India. BMC Public Health. 2022;22:7.
- [CrossRef] [PubMed] [Google Scholar]
- Determinants of social network site preferences for accessing reproductive health information among university students in Nairobi. Int J Med J Mass Commun. 2018;4:11-20.
- [Google Scholar]
- Platelet rich plasma therapy: A quick note for every health care professional. Int J Life Sci Pharma Res. 2020;10:P84-9.
- [CrossRef] [Google Scholar]
- Hunting hantavirus: A quick guide for healthcare professionals before it invades the globe unlike COVID-19. Int J Pharm Phytopharmacol Res. 2020;10:1-6.
- [Google Scholar]
- A desk top allusion to the rare orphan diseases and orphan drugs: Possessions to discern by every healthcare professional. Asian J Res Pharm Sci. 2021;11:247-52.
- [CrossRef] [Google Scholar]
- Clustered regularly interspaced short palindromic repeats and its associated protein-9: Drug delivery and therapeutic applications. J Young Pharm. 2022;14:268-72.
- [CrossRef] [Google Scholar]
- Fabrication of glimepiride Datura stramonium leaves mucilage and poly vinyl pyrrolidone sustained release matrix tablets: In vitro evaluation. Kathmandu Univ J Sci Eng Technol. 2012;8:63-72.
- [CrossRef] [Google Scholar]
- Black fungus: A lethal communal issue after winning the life battle against COVID-19. Biomed Pharmacol J. 2021;14:2095-101.
- [CrossRef] [Google Scholar]
- Health and health behaviors in China: Anomalies in the SES-health gradient? SSM Popul Health. 2022;17:101069.
- [CrossRef] [PubMed] [Google Scholar]
- Prevalence and impact of low back pain in a community-based population in northern India. Pain Physician. 2020;23:E389-98.
- [CrossRef] [Google Scholar]
- Physical activity interventions promoted in the Arabic-speaking region: A review of the current literature. Obes Rev. 2020;21:e13032.
- [CrossRef] [PubMed] [Google Scholar]
- Physical inactivity, gender and culture in Arab countries: A systematic assessment of the literature. BMC Public Health. 2018;18:639.
- [CrossRef] [PubMed] [Google Scholar]
- Impact of COVID-19 on women and children and the need for a gendered approach in vaccine development. Hum Vaccin Immunother. 2020;16:2932-7.
- [CrossRef] [PubMed] [Google Scholar]
- Obesity, diabetes, hypertension and severe outcomes among inpatients with Coronavirus disease 2019: A nationwide study. Clin Microbiol Infect. 2022;28:114-23.
- [CrossRef] [PubMed] [Google Scholar]
- Gender difference in general self-efficacy among young-old elderly aged 60-74 in rural Shandong China: A cross-sectional survey. Int J Environ Res Public Health. 2019;16:5070.
- [CrossRef] [PubMed] [Google Scholar]
- Perceptions of self-determination and quality of life among Swedish home care recipients-a cross-sectional study. BMC Geriatr. 2019;19:142.
- [CrossRef] [PubMed] [Google Scholar]
- Factors underlying unmet medical needs: A cross-sectional study. Int J Environ Res Public Health. 2019;16:2391.
- [CrossRef] [PubMed] [Google Scholar]
- Knowledge, perception, performance, and attitude regarding hand hygiene and related factors among infection control nurses in South Korea: A cross-sectional study. Am J Infect Control. 2019;47:258-63.
- [CrossRef] [PubMed] [Google Scholar]
- Impact on mental health and perceptions of psychological care among medical and nursing staff in Wuhan during the 2019 novel Coronavirus disease outbreak: A cross-sectional study. Brain Behav Immun. 2020;87:11-7.
- [CrossRef] [PubMed] [Google Scholar]
- IoT-based telemedicine for disease prevention and health promotion: State-of-the-Art. J Netw Comput Appl. 2021;173:102873.
- [CrossRef] [Google Scholar]
- Self-rated health and health-related quality of life are related with adolescents' healthy lifestyle. Public Health. 2019;170:89-94.
- [CrossRef] [PubMed] [Google Scholar]
- Mediating effect of sleep satisfaction on the relationship between stress and self-rated health among Korean adolescents: A nationwide cross-sectional study. Child Youth Serv Rev. 2020;109:104717.
- [CrossRef] [Google Scholar]
- Expectations of healthcare quality: A cross-sectional study of internet users in 12 low-and middle-income countries. PLoS Med. 2019;16:e1002879.
- [CrossRef] [PubMed] [Google Scholar]
- The effect of applying TPS type cooperative learning model assisted by SPSS software on students' skills in IT-based statistical data analysis course. J Phys Conf Ser. 2020;1581:012027.
- [CrossRef] [Google Scholar]
- Effect of COVID-19 pandemic-induced dietary and lifestyle changes and their associations with perceived health status and self-reported body weight changes in India: A cross-sectional survey. Nutrients. 2021;13:3682.
- [CrossRef] [PubMed] [Google Scholar]
- Fuzzy comprehensive evaluation with AHP and entropy methods and health risk assessment of groundwater in Yinchuan Basin, northwest China. Environ Res. 2022;204:111956.
- [CrossRef] [PubMed] [Google Scholar]
- The role of age, education, and digital health literacy in the usability of internet-based cognitive behavioral therapy for chronic pain: Mixed methods study. JMIR Form Res. 2019;3:e12883.
- [CrossRef] [PubMed] [Google Scholar]