Translate this page into:
Impact of Laboratory Biomarkers on COVID-19 Severity: First Cross-sectional Study in a Remote Area of Pakistan
 M.Phil., Muhammad Salman1PhD., Riaz Muhammad1PhD., Sher Ali2PhD., Attaullah3M.Phil., Muddasir Khan4M.Phil.

-
Received: ,
Accepted: ,
How to cite this article: Abdullah, Salman M, Muhammad R, Ali S, Attaullah, Khan M. Impact of Laboratory Biomarkers on COVID-19 Severity: First Cross-sectional Study in a Remote Area of Pakistan. Glob J Med Pharm Biomed Update. 2024;19:6. doi: 10.25259/GJMPBU_79_2023
Abstract
Objectives:
The study aimed to evaluate the performance of rapid antigen test (RAT) and reverse transcription polymerase chain reaction (RT-PCR) in detecting COVID-19 and the impact of laboratory biomarkers on the severity of the disease.
Material and Methods:
A total of 150 nasopharyngeal swabs and blood samples were collected from symptomatic COVID-19 patients in Tehsil head-quarter Hospital, Dargai from August 2021 to March 2022.
Results:
RAT revealed a sensitivity of 86.67% and specificity of 100%, while RT-PCR revealed a sensitivity of 93.33% and specificity of 100%. The highest infection rate was found in males, and the average age of patients was 53.87 years. The most common symptoms were fever and sore throat. Patients were categorized into four groups based on cycle threshold values and blood biomarkers: mild, moderate, severe, and critical. White blood cell count, platelet count, and C-reactive protein were significantly different between the groups. Lactate dehydrogenase, D-dimer, and serum ferritin were significantly increased in critical patients. The receiver operating characteristic curve showed that inflammatory biomarkers had a comparative performance in predicting disease severity in COVID-19 patients.
Conclusion:
Blood biomarkers are associated with the disease severity in COVID-19 patients, and further studies, such as metabolomics, are recommended to explore the immunological mechanisms behind these biomarkers.
Keywords
SARS-CoV-2
Diagnosis
Rapid antigen test
Real-time polymerase chain reaction
Inflammatory biomarkers
Severity

INTRODUCTION
Viral diseases with zoonotic origins have affected public health in recent years.[1-3] The 21st century has seen outbreaks of various viruses such as Zika, CoVs, Nipah, and Ebola.[4] In late 2019, a mysterious respiratory illness emerged in Wuhan, China.[5] The cause was identified as the novel coronavirus (SARS-CoV-2) in February 2020, and the illness was named COVID-19.[6] COVID-19 is considered the 5th pandemic since the 1918 flu and is highly contagious. The World Health Organization declared it a pandemic in April 2020.[7] The symptoms of COVID-19 can vary, ranging from asymptomatic or mild infection to severe cases that can result in death.[8]
Early symptoms include fever, cough, nasal congestion, malaise, headache, shortness of breath, myalgia, dyspnea, nausea/vomiting, sore throat, and diarrhea.[9] The National Health Commission in China has divided COVID-19 patients into mild, moderate, severe, and critical categories based on symptoms.[10] The World Health Organization (WHO) and the Centers for Disease Control have formulated criteria for diagnosing COVID-19, including real-time polymerase chain reaction (RT-PCR), computed tomography (CT) imaging, next-generation sequencing (NGS), rapid antigen tests, enzyme-linked immune sorbent assay, and others.[11-13] RT-PCR, NGS, and nucleic acid amplification tests are the most commonly used methods, with RT-PCR capable of detecting SARSCoV-2 RNA in respiratory samples.[14,15] COVID-19 patients may also have variations in hematological parameters such as neutrophils, eosinophils, basophils, monocytes, lymphocytes, and thrombocytes.[6] Inflammatory biomarkers such as C-reactive protein (CRP) can also be present. CRP, lactate dehydrogenase (LDH), D-dimer, and serum ferritin are prominent biomarkers for predicting COVID-19 progression. COVID-19-associated coagulopathy and thrombosis are commonly observed problems due to elevated levels of D-dimer. Aberrations in hemostasis have also been observed due to elevated levels of D-dimer. Studies have confirmed a higher level of ferritin (hyperferritinemia) in COVID-19, which leads to macrophage activation syndrome.[16-20]
This study aimed to compare the rapid antigen tests and RTPCR diagnostic performance for COVID-19 in symptomatic individuals, including their sensitivity, specificity, and positive- and negative predictive values. It also examines the correlation between hematological parameters such as complete blood count (CBC) and inflammatory biomarkers (CRP, LDH, D-dimer, and serum ferritin) with disease severity in SARS-CoV-2 RNA-positive individuals in the district of Malakand, KPK, Pakistan.
MATERIAL AND METHODS
A cross-sectional study of 150 symptomatic COVID-19 patients was conducted at Tehsil Head-quarter Hospital, Dargai, district of Malakand, from August 2021 to March 2022. A total of 150 patients were confirmed through rapid antigen testing (Abbot) and quantitative RT-PCR (Genuri-ABI 7500) using nasopharyngeal swabs. Blood samples (10 mL) were collected in three different tubes (gel, ethyl diamine tetra acetic acid (EDTA), and sodium citrate) and analyzed using a hematology analyzer (Sysmex XP-100) for laboratory parameters such as CBC, CRP, LDH, D-dimer, and serum ferritin. CRP and LDH levels were measured using ROCHE Cobas, and levels of serum ferritin and D-dimer were measured using Biomerieux (mini Vidas, France). The patients were categorized into mild, moderate, severe, and critical groups based on a cycle threshold value (Ct-value) and hematological parameters following previous research.[21,22] The data were analyzed using SPSS version 22.0, and descriptive statistics, Chi-square test, and one-way analysis of variance were performed. P < 0.05 was considered statistically significant.
RESULTS
Demography of study population
The study took place at Tehsil Head-Quarter Hospital in Dargai, Malakand district. A total of 150 individuals of both genders were studied. The initial screening of symptomatic patients was performed using RAT at Talha Clinical Laboratory, Dargai District. Of the individuals screened, 130 (86.7%) tested positive for SARS-CoV-2, while the rest tested negative. The final confirmation of suspected patients was performed using RT-PCR. Of the 150 individuals examined, 140 (93.3%) were confirmed positive for SARS-CoV-2. Of those positive, 81 (57.9%) were male and 59 (42.1%) were female (P < 0.278). The frequency of COVID-19 in both genders and different disease groups is shown in Table 1. The patients were divided into three age groups: 21–40, 41–60, and 61–80 years. The average age of the patients was 53.87, while the average age of severe/critical patients was 54.64 ± 14.96, and that of the remaining patients was 52.45 ± 9.23. The highest prevalence of COVID-19 was found in the 41–60 age group (49.3%), followed by the 61–80 (39.6%) and the 21–40 (17.9%) age groups, as shown in Table 1. The bivariate analysis showed a positive correlation (r = 0.065) between patient age and gender. An Eta coefficient analysis revealed a strong association (0.65) between gender and age, with Eta2 (0.42) indicating that 42% of gender is affected by age. The most common symptoms were fever (94.2%), followed by sore throat (92.8%), body aches (82.1%), chest pain (81.4%), headache (69.2%), cough (64.2%), weakness (46.4%), smell and taste disturbances (27.8%), shortness of breath (16.4%), headache (16.4%), and nausea (16.4%), as shown in Figure 1. The study also examined comorbidities in positive patients, as shown in Figure 2.
| Mild n (%) | Moderate n (%) | Severe n (%) | Critical n (%) | Total n (%) | P-Value | |
|---|---|---|---|---|---|---|
| Gender | ||||||
| Male | 17 (21.0) | 48 (59.3) | 7 (8.6) | 9 (11.1) | 81 (57.9) | 0.276 |
| Female | 17 (28.8) | 33 (55.9) | 7 (11.9) | 2 (3.4) | 59 (42.1) | |
| Age groups | ||||||
| 21–40 | 7 (28.0) | 14 (17.3) | 3 (12.9) | 1 (4.0) | 25 (17.9) | 0.883 |
| 41–60 | 16 (23.2) | 38 (55.1) | 8 (11.6) | 7 (10.1) | 69 (49.3) | |
| 61–80 | 11 (23.9) | 29 (63.0) | 3 (6.5) | 3 (6.5) | 46 (39.6) | |
| Mean (SD±) | 52.88±13.23 | 54.35±14.80 | 54.64±14.96 | 52.45±9.23 | 53.87±13.97 |
SD: Standard deviation
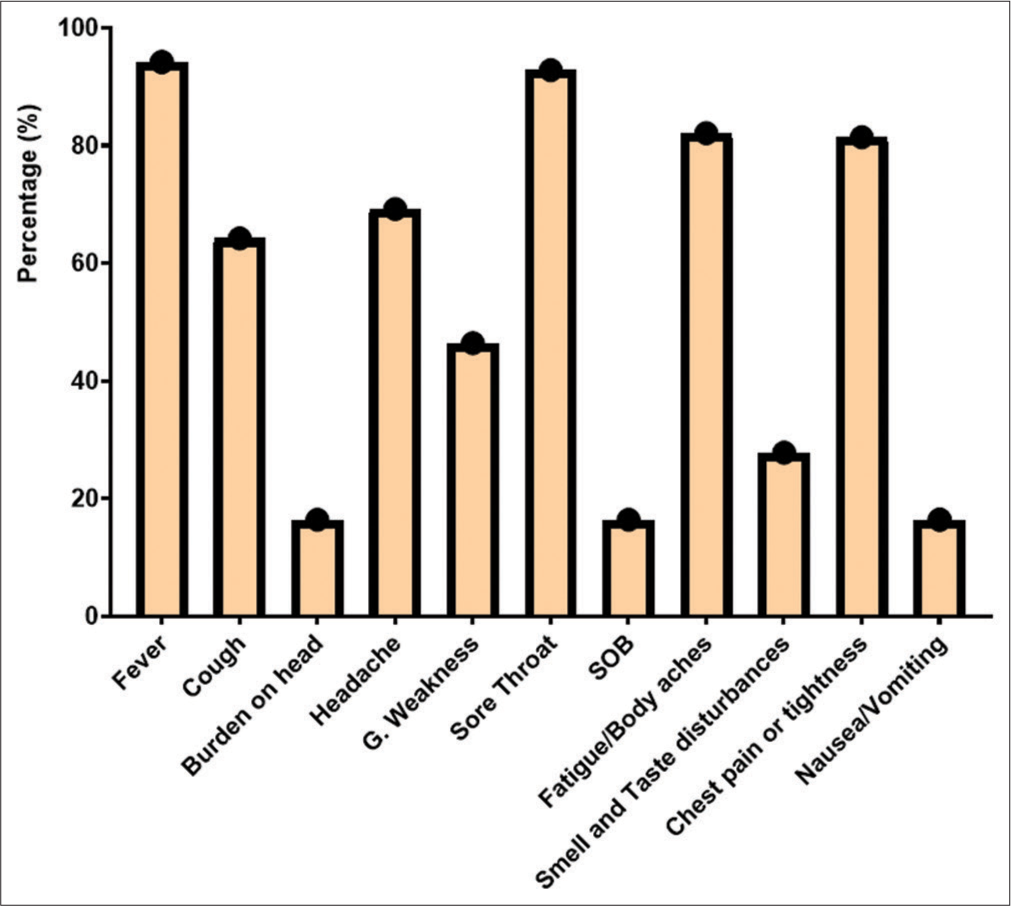
- Sign and symptoms of COVID-19 patients. SOB: Shortness of Breath.
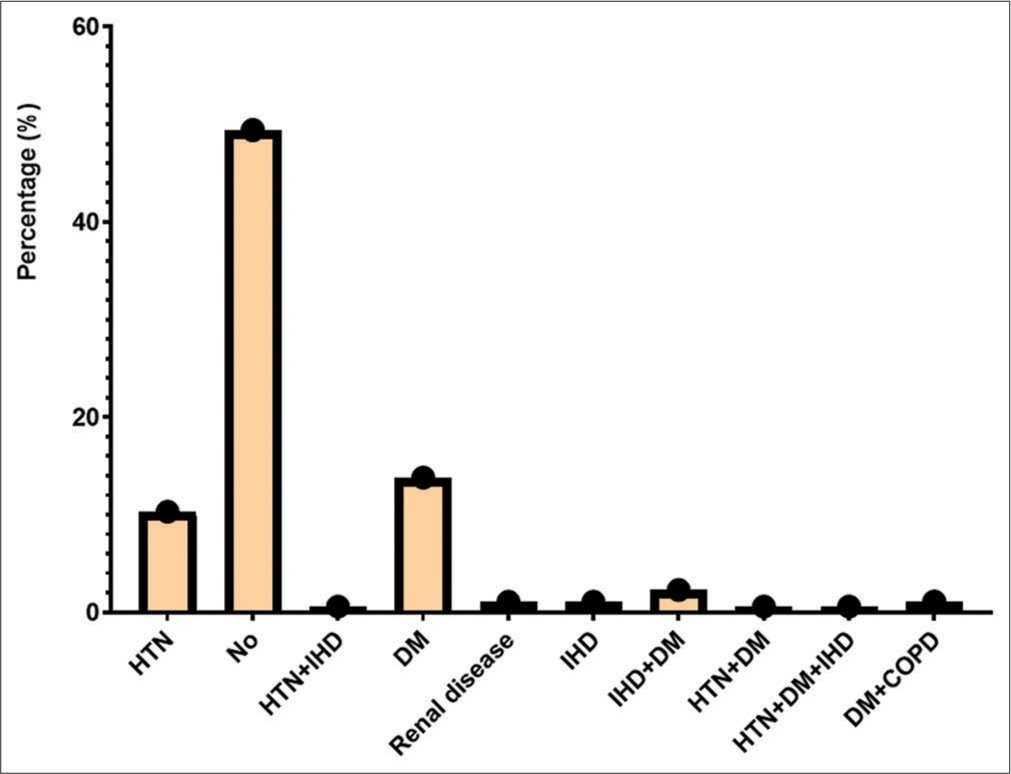
- Comorbidities in COVID-19 patients. NO: No symptom, HTN: Hypertension, IHD: Ischemic heart disease, DM: Diabetes mellitus, COPD: Chronic obstructive pulmonary disease.
The patients were classified into four groups: Mild, moderate, severe, and critical, based on the Ct-value, hematological parameters, and inflammatory biomarkers. The study recorded 24.2% mild, 71.5% moderate, 10% severe, and 7.8% critical cases. A Ct-value of less than 40 was considered an indicator of detectable RNA. The mean Ct-value of all patients was 29.08 (28.19–29.96), while the mean Ct-value of severe and critical cases was significantly lower (P < 0.001) compared to mild and moderate patients, indicating a higher viral load in severe and critical cases [Figure 3].
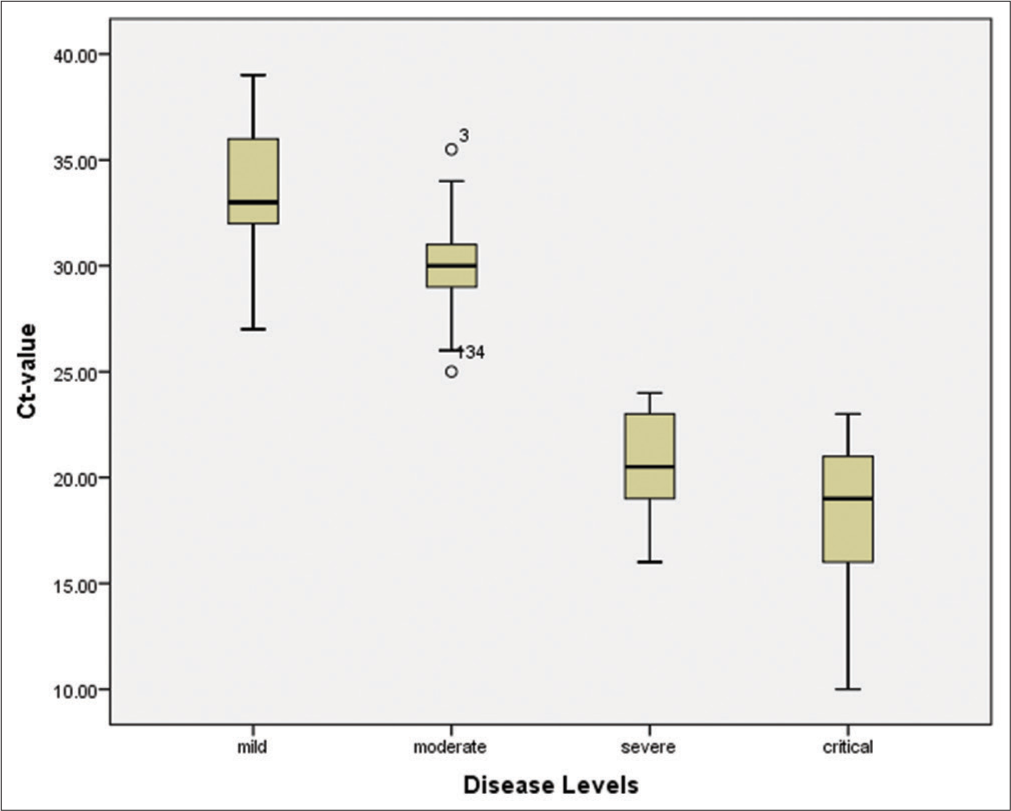
- Cycle threshold values of the patients in severe/critical disease groups are significantly (<0.001) lower compared to mild-moderate patient.
Diagnostic performance of RAT and RT-PCR
Out of all symptomatic individuals (n = 150), 130 (86.7%) tested positive for SARS-CoV-2 with a mean ± standard deviation (SD) of 1.13 ± 0.341. Meanwhile, 20 (13.3%) tested negative using the RAT assay (Abbott). The sensitivity of the RAT assay was 86.67% (95% confidence interval [CI]: 80.16–91.66%), while its specificity was 100.00% (95% CI: 83.16–100.00%). The positive predictive value (PPV) and negative predictive value (NPV) were 86.67% (95% CI: 80.1–91.66%) and 50.00% (95% CI: 39.94–60.06%), respectively. On the other hand, 140 (93.3%) patients were diagnosed positive by RT-PCR with a mean ± SD of 1.07 ± 0.25, and 10 (6.7%) tested negative. The sensitivity of RT-PCR was found to be 93.33% (95% CI, 88.08–96.76%), and its specificity was 100.00% (95% CI, 69.15–100.00%). Meanwhile, the PPV and NPV of RT-PCR were noted as 93.33% (95% CI, 90.01–95.60%) and 50.00% (95% CI, 35.46–64.54%), respectively. These findings suggest that due to its high sensitivity, RT-PCR detects a significantly higher viral load (P < 0.001) compared to the RAT assay [Table 2]. The Ct-value < 40 was considered a sign of detectable RNA in the patients. The overall mean Ct-value was 29.08 (28.19–29.96), and the mean Ct-value of the severe/critical disease groups was significantly lower (P < 0.001) compared to the mild-moderate patients [Table 3].
| Variables | RAT | RT-PCR |
|---|---|---|
| Total samples | 150 | 150 |
| Positive | 130 | 140 |
| Negative | 20 | 10 |
| Sensitivity% (95% CI) | 86.67% (80.16–91.66%) |
93.33% (88.08–96.76%) |
| Specificity% (95% CI) | 100.00% (83.16–100.00%) |
100.00% ( 69.15–100.00%) |
| PPV% (95% CI) | 86.67% (80.1–91.66%) |
93.33% (90.01–95.60%) |
| NPV% (95% CI) | 50.00% (39.94–60.06%) |
50.00% ( 35.46–64.54%) |
| Accuracy | 88.24% (82.42–92.66%) |
93.75% (88.81–96.96%) |
| P-value | <0.001 | |
RAT: Rapid antigen test, RT-PCR: Reverse transcription polymerase chain reaction,CI: Confidence Interval, PPV: Positive predictive value, NPV: Negative predictive value.
| Parameters | Total n=140 | Mild n=34 (24.2%) | Moderate n=81 (71.5%) | Severe n=14 (10%) | Critical n=11 (7.8%) | P-value |
|---|---|---|---|---|---|---|
| WBC 109/L | 8.19 (7.71–8.66) | 5.89 (5.26–6.52) | 7.94 (7.54–8.35) | 10.93 (10.56–11.30) | 13.51 (11.04–15.99) | <0.001 |
| Lymph % | 23.70 (22.12–25.28) | 24.58 (22.74–28.24) | 27.80 (24.14–29.41) | 10.64 (6.34–12.83) | 7.45 (1.23–8.64) | <0.001 |
| HB g/dL | 12.80 (12.50–13.10) | 13.12 (12.57–13. 66) | 12.59 (12.18–13.00) | 12.65 (11.58–13.72) | 13.55 (12.45–14. 67) | 0.23 |
| NEUT% | 78.13 (76.45–79.82.) | 76.12 (72.96–79.32) | 79.04 (77.00–81.09) | 81.35 (75.58–87.13) | 73.45 (62.54–84.35) | 0.12 |
| Platelets 109/L | 213.58 (194.59–232.57) | 294.26 (266.65–321.87) | 218.20 (194.00–242.41) | 105.14 (99.28–110.99) | 68.18 (49.71–86.65) | <0.001 |
| MCH Pg | 27.14 (26.59–27.69) | 27.12 (26.13–28.12) | 27.36 (26.58.–28.15) | 26.49 (25.26–27.720 | 26.40 (23.75–29.06) | 0.69 |
| MCHC g/dL | 33.59 (33.41–33.76) | 33.45 (33.15–33.75) | 33.64 (33.41–33.87) | 33.72 (33.03–34.40) | 33.44 (32.48–34.40) | 0.751 |
| RBCs 1012/L | 4.59 ( 4.49–4.70) | 4.58 (4.41–4.47) | 4.65 (4.50–4.80) | 4.32 (3.97–4.66)) | 4.58 (4.04–5.11) | 0.36 |
| MCV Fl | 83.64 (82.13–85.13) 9 | 84.31 (81.71–86.91) | 83.04 (80.96–85.12) | 85.87 (82.16–89.57) | 83.10 (74.74–91.51) | 0.69 |
| HCT % | 40.69 (39.62–41.75) | 40.48 (38.72–42.25) | 40.57 (38.95–42.18) | 41.22 (38.90–44.02) | 41.22 (37.65–44.79) | 0.95 |
| CRP mg/L | 18.72 (15.31–22.11) | 2.79 (2.33–3.25) | 14.35 (12.56–16.14) | 40.45 (35.77–45.14) | 72.38 (60.77–83.98) | <0.001 |
| LDH U/L | 634.10 (593.12–675.09) | 525.67 (459.11–592.23) | 623.85 (578.26–669.43) | 671.28 (574.00–768.57) | 997.45 (736.16–1258.74 | <0.001 |
| D-DIMER ng/mL | 2614.99 (2080.14–3149.84) | 321.08 (268.51–373.66) | 1830.91 (1584.92–2076.90) | 6286.78 (5445.02–7128.54) | 10805.72 (8281.37–13330.08) | <0.001 |
| Ferritin ng/mL | 590.26 (522.81–657.7) | 207.85 (162.62–253.07) | 554.48 (526.78–582.17) | 896.92 (773.19–1020.66) | 1645.45 (1376–1914.05) | <0.001 |
| Ct values | 29.08 (28.19–29.96) | 33.64 (32.71–34.58) | 30.11 (29.69–30.53) | 20.71 (19.29–22.1) | 18.00 (15.23–20.76) | <0.001 |
WBC: White blood cell, Hb: Hemoglobin, NEUT: Neutrophil, MCH: Mean corpuscular hemoglobin, MCHC: Mean corpuscular hemoglobin concentration, RBC: Red blood cells, MCV: Mean corpuscular volume, HCT: Hematocrit, CRP: C-reactive protein, LDH: Lactate dehydrogenase, Ct: Cycle threshold
This indicates that patients in the severe/critical groups had a higher viral load as compared to mild-moderate patients.
Hematological and biomarkers status of COVID-19 patients
Among all 150 positive individuals, the blood samples of 140 patients (positive by RT-PCR) were processed for the measurement of hematological parameters and inflammatory biomarkers. The following were evaluated: White blood cells (WBCs), lymphocyte count (%), hemoglobin, neutrophil count (%), platelet count, mean corpuscular hemoglobin (MCH), mean corpuscular hemoglobin concentration (MCHC), red blood cells (RBCs), mean corpuscular volume (MCV), and hematocrit (HCT). The WBCs were elevated in the severe/critical disease groups compared to the mild/moderate groups [Figure 4 and Table 3]. Similarly, the lymphocyte count was significantly (P < 0.001) decreased (7.45%) in critically ill patients compared to other groups [Figure 5 and Table 3]. According to the correlation analysis, a significant correlation was found between the WBC count and the lymphocyte count (r = 0.513, P < 0.001). A minor deviation was observed in the hemoglobin levels (13.55 g/dL) in the comparative disease groups, but no significant association was found with disease severity (P > 0.05). The neutrophil count was found to be increased in all disease groups, with a slightly higher increase in the severe/critical groups compared to the mild/moderate groups. A positive correlation was also observed between the WBCs and the neutrophil count (r = 0.025, P > 0.05). Furthermore, the platelet count was significantly decreased in the severe (105.14 × 10⁹/L) and critical (68.18 × 10⁹/L) patients compared to the mild and moderate groups (P < 0.001). These results are shown in Figure 6 and Table 3.
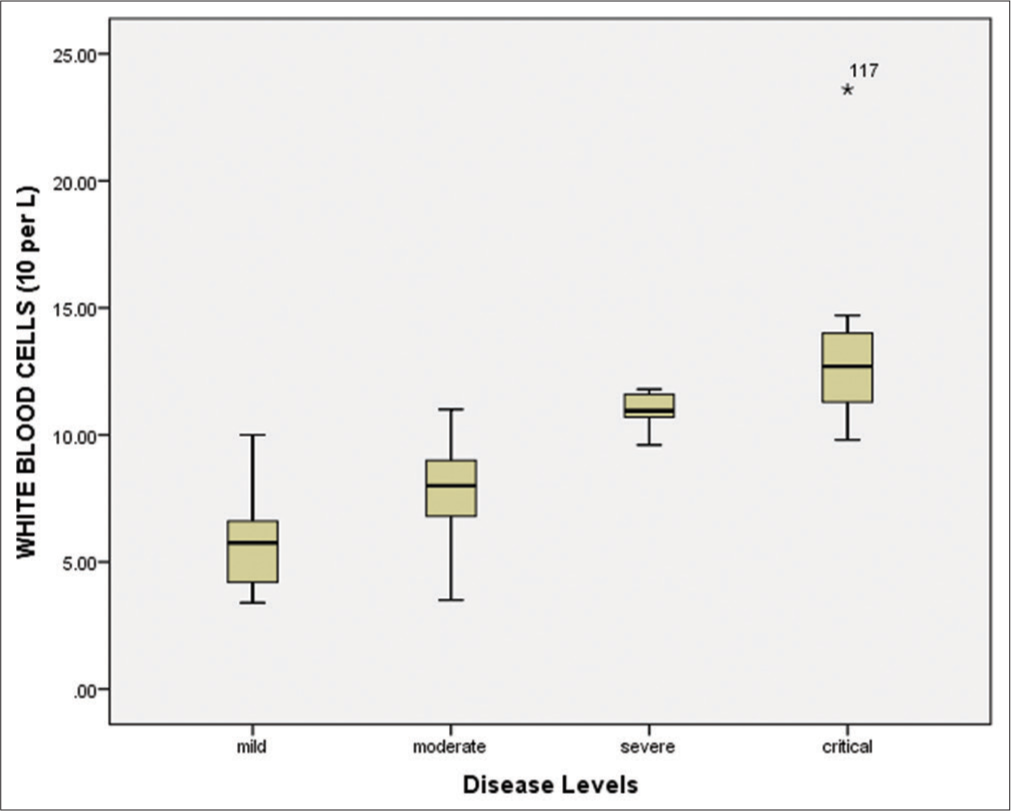
- White blood cells (109/L) in different diseased groups. T-test and One-Way Analysis of Variance were applied to determine significant association, and P < 0.05 was considered significant at 95% confidence interval.
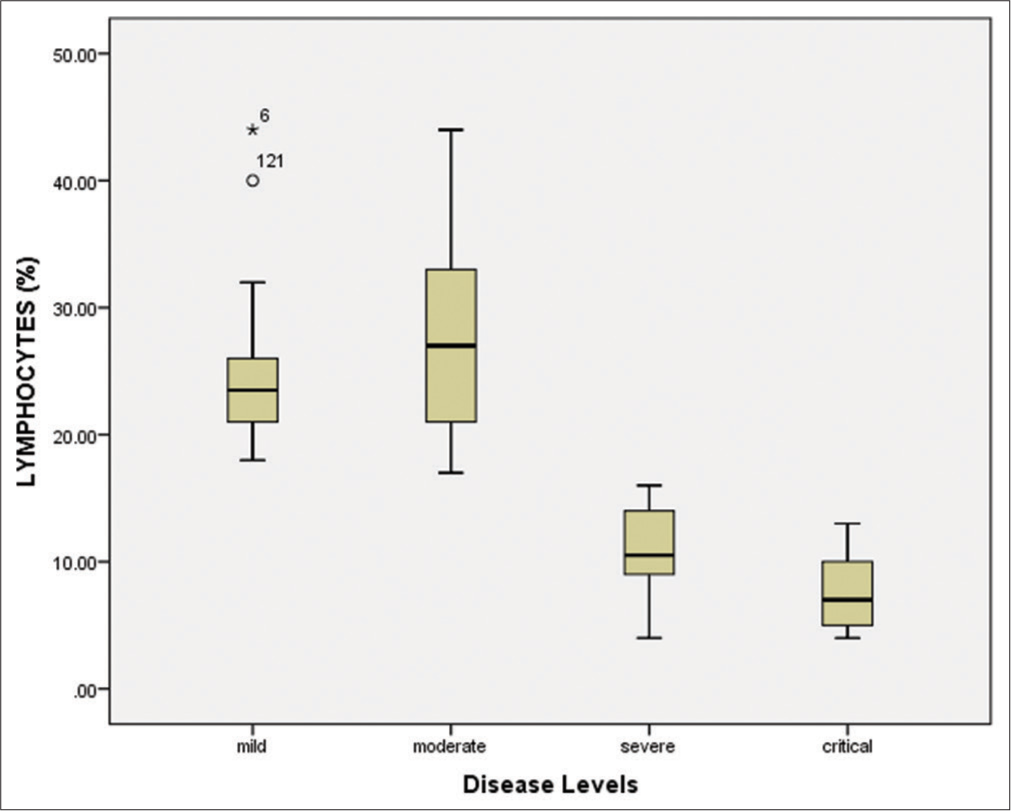
- Lymphocytes count (%) in different diseased groups. T-test and One-Way Analysis of Variance and descriptive statistics were applied to determine significant association, and P < 0.05 was considered significant at 95% confidence interval. The critical diseased patients represented low levels lymphocytes count as compared to other groups.
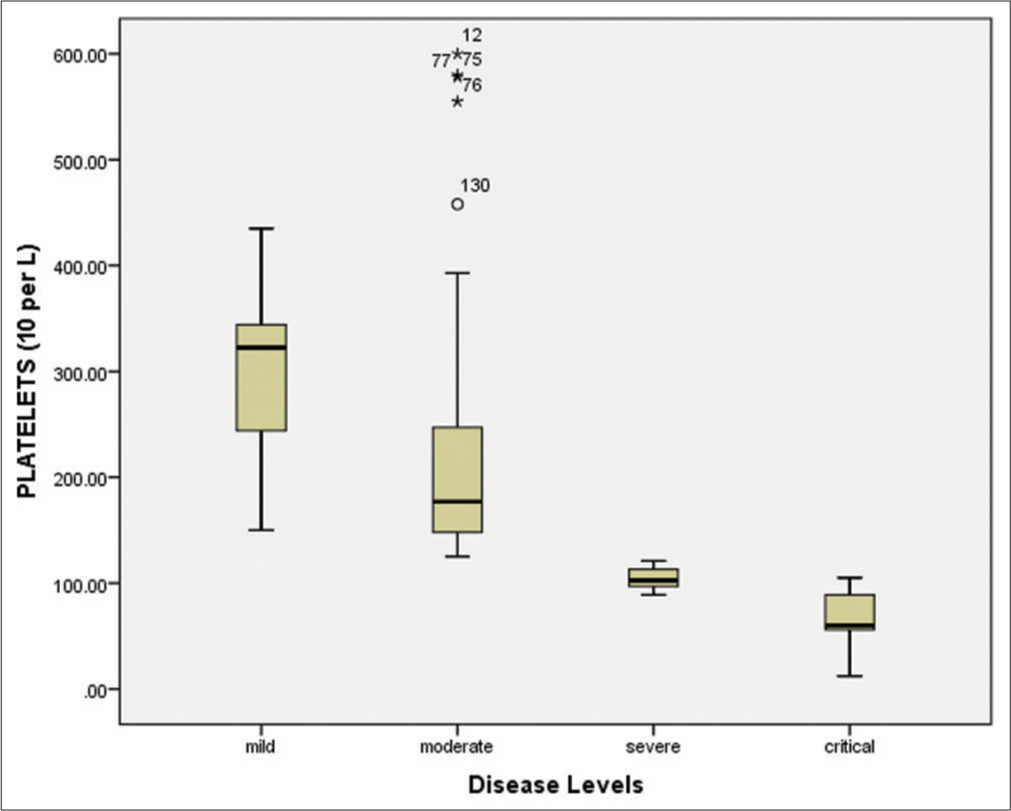
- Platelets count (109/L) in different diseased groups. T-test and One-Way Analysis of Variance and descriptive statistics were applied to determine significant association, and P < 0.05 was considered significant at 95% confidence interval. The critical diseased patients represented decreased levels of platelet count as compared to other groups.
The bivariate correlation test revealed a significant negative correlation (r = – 0.528, P < 0.001) between the WBC count and the platelet count (109/L). The mean RBC count was slightly elevated in critical patients (5.11 × 10¹²/L) compared to other disease groups. However, no significant association was found between disease severity levels and the RBC count (P = 0.36), as depicted in Table 2. The MCH was found to be consistent across all disease groups (P = 0.69). Similarly, the MCHC was slightly decreased in severe and critical patients, but there was no significant association with disease severity (P = 0.751). The MCV was observed to be within the normal range (80–100 fL) across all disease groups and had no significant association with disease severity (P > 0.05). Similarly, the hematocrit percentages also showed no significant association with disease severity (P > 0.05). The present study also evaluated inflammatory biomarkers, such as CRP, LDH, D-dimer, and serum ferritin in individuals positive for SARS-CoV-2. Our results showed that the mean CRP values were significantly increased (P < 0.001) in severe (40.45 mg/L) and critical (72.38 mg/L) patients compared to moderate (14.35 mg/L) and mild (2.79 mg/L) disease groups [Table 3].
According to bivariate analysis, CRP had a strong positive correlation (r = 0.676) with WBCs. Similarly, LDH was significantly (P < 0.001) elevated in critically ill patients (997.45 U/L) compared to mild (525.67 U/L) and moderate (623.85 U/L) disease groups [Table 3]. The bivariate analysis showed a positive correlation (r = 0.446, P < 0.001) between LDH and CRP levels. Our findings regarding the inflammatory biomarkers also revealed a significant elevation (P < 0.001) in D-dimer assay in critical (10805.72 ng/mL) and severe (6286.78 ng/mL) disease groups compared to mild and moderate groups [Table 3]. The study also found a significant (<0.001) increase in the D-dimer assay in critically (10805.72 ng/mL) and severely (6286.78 ng/mL) ill patients compared to those in the mild and moderate disease groups [Table 3]. Similarly, the serum ferritin levels were significantly (<0.001) higher in critically (1645.45 ng/mL) and severely (896.92 ng/mL) ill individuals compared to those in the other disease groups [Table 3]. The bivariate correlation analysis showed that D-dimer and serum ferritin are positively correlated (r = 0.313, P < 0.001). The receiver operating characteristic curve indicated that the inflammatory biomarkers and disease levels had comparable diagnostic performance in predicting disease severity in COVID-19 patients. The area under the curve (AUC) for D-dimer was 0.913 (P < 0.001), followed by CRP (AUC = 0.915, P < 0.001), WBCs (AUC = 0.899, P < 0.001), serum ferritin (AUC = 0.879, P < 0.001), and LDH (AUC = 0.569, P < 0.401), as shown in Figure 7.
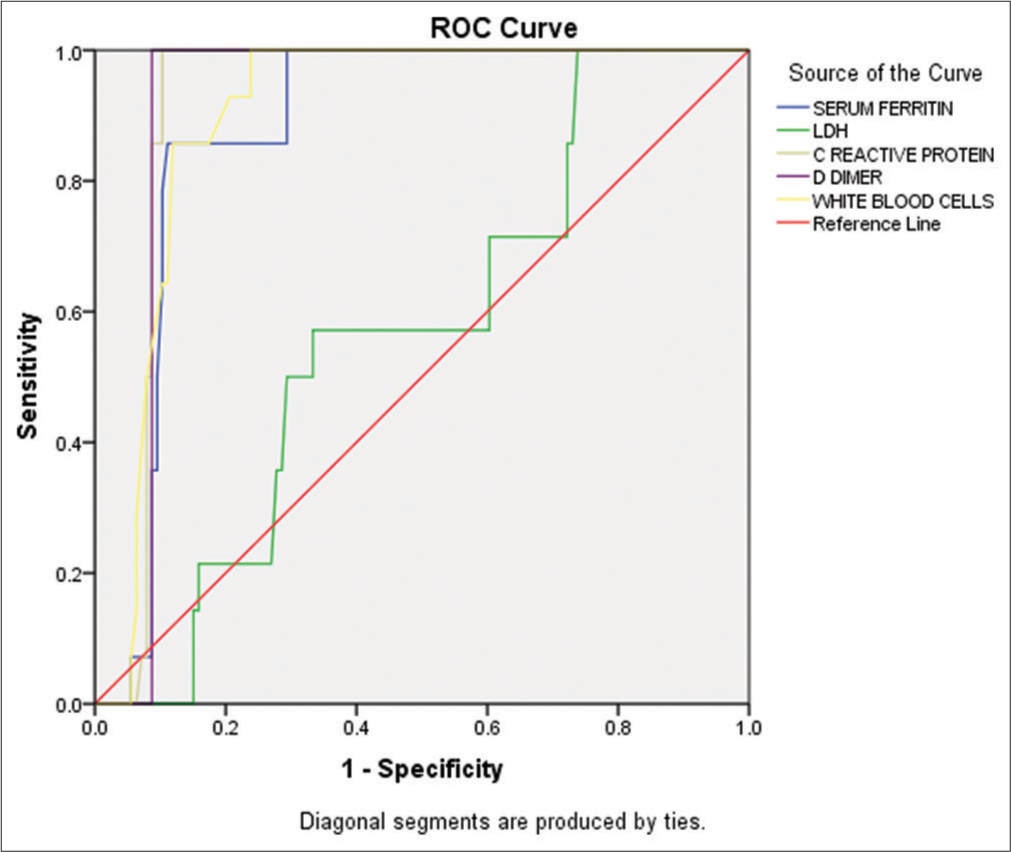
- Receiver operating characteristic curve for different inflammatory biomarkers and white blood cells (WBCs). The curve showed comparative diagnostic performance of inflammatory biomarkers, WBC disease levels, and predicting disease severity in COVID-19 patients. ROC: Receiver operating characteristic curve, LDH: Lactate dehydrogenase.
DISCUSSION
COVID-19 is the most significant health and economic crisis of this century, affecting the entire world with its contagious nature. Various variants, such as alpha, beta, gamma, delta, and omicron, have emerged during this pandemic, causing millions of cases and deaths. As of February 11, 2023, 677.69 million cases and 6.7 million deaths were reported globally (https://www.worldometers.info/coronavirus).
The study aimed to compare two COVID-19 diagnostic methods, RAT and RT-PCR, and to evaluate hematologic (CBC) and inflammatory biomarkers (CRP, LDH, D-dimer, and serum ferritin) for disease severity in SARS-CoV-2 RNA-positive individuals. The study enrolled 150 symptomatic individuals and used RAT as the primary screening, with results compared to RT-PCR. RAT detected 130 positive cases (mean ± SD: 1.13 ± 0.341) and 20 negative cases.
In the study, 140 of 150 patients were positive for SARS-CoV-2 by RT-PCR with a mean of 1.07 ± 0.25. Males (n=81, 57.9%) were more affected than females (n=59, 42.1%), consistent with studies in Lahore[23] and Hong Kong [24] but contradicting a review by Hocková et al.[25]. Demographic analysis indicates a higher frequency of COVID-19 in males compared to females.[25]
In this study, patients were divided into three age groups, and the average age was 53.87 years. The highest number of COVID-19 cases was found in the 41-60 age group (49.3%), followed by the 61–80 age group (39.6%) and the 21–40 age group (17.9%). This aligns with other studies that have identified people over 40 as being at high risk for COVID-19.[26] Interestingly, no individuals under the age of 20 were reported in this study. Previous research from various regions has found COVID-19 cases in children under 12 months of age.[27] Based on our findings, it is clear that individuals over 40 years old are at a high risk of contracting COVID-19. The analysis of symptoms in SARS-CoV-2-positive patients revealed that fever (94.2%), sore throat (92.8%), body aches (82.1%), chest pain (81.4%), headache (69.2%), dry cough (64.2%), weakness (46.4%), disturbances in smell and taste (27.8%), shortness of breath (16.4%), head pressure (16.4%), and nausea (16.4%), were consistent with the findings of other studies.[28,29] However, it should be noted that not all COVID-19 patients experience fever, as other studies have found.[23,30] The study highlights the importance of paying attention to patients who do not present with fever during the diagnosis process.
The RAT assay had a sensitivity of 86.67% (95% CI: 80.16–91.66%) and a specificity of 100.00% (95% CI: 83.16–100.00%) when compared to RT-PCR. These results meet the criteria recommended by the WHO, which require a sensitivity of at least 80% and a specificity of at least 97% for RAT.[31] Torres et al. also found that RAT had a sensitivity of 80% and a specificity of 100% in symptomatic COVID-19 patients, in line with these criteria.[32] However, it should be noted that these criteria are only applicable to symptomatic individuals suspected of having COVID-19 after 5–10 days of symptom onset. Pilarowski et al. and Onsongo et al. found similar results, with RAT having a sensitivity of 93.3% and 87.7%, respectively, and specificities above 95%.[33,34] In our study, a positive RT-PCR result was defined as a Ct-value of <40, with a mean Ct-value of 29.08 (28.19–29.96). The mean Ct-values for patients with severe (20.71) and critical (18.00) disease were significantly lower than those with mild-moderate disease. This aligns with findings from Hay et al. and Mishra et al. that suggest a low Ct-value may indicate high viral load and severity in COVID-19.[35,36] It is important to note that the Ct-value is inversely proportional to the amount of virus in the sample, with a lower value indicating a higher viral load. According to Phillips et al., the viral load decreases 10-fold for every 3.3-fold increase in the Ct-value.[37]
The study evaluated hematologic and inflammatory biomarkers in 140 SARS-CoV-2-positive patients. White blood cell count was found to be significantly elevated (P < 0.001) in critical patients, which is consistent with the previous studies.[26,38] This increase suggests an early stage of viral infection, where immune cells accumulate at the site of infection. Lymphopenia was also observed in critical and severe patients, which can be caused by the virus’s direct cytotoxic effect or the inflammatory cytokines.
Lymphocytes are important in adaptive immunity by neutralizing antigens. There are two main possibilities for the decrease in lymphocyte count with increasing severity of COVID-19 infection. First, the SARS-CoV-2 enters the host cell, replicates inside the cell, and then spreads. The virus’s concentration increases in those cells that express the angiotensin-converting enzyme 2 (ACE2) receptor, which is one of the receptors that the virus identifies and binds to the target cell, followed by entry to the cell. At this stage, the inflammatory cytokines increase while the lymphocytes (both T and B) are decreased.[39] Second, the number of lymphocytes is decreased due to the direct cytotoxic effect of the virus. Because the lymphocytes also express the ACE2 receptor to which the SARS-CoV-2 is easily attached and enters the cell, which leads to the destruction of the lymphocytes, the number of lymphocytes decreases, termed as lymphopenia.[39-41] This finding supports previous studies that reported lymphopenia and leukocytosis as strong diagnostic criteria for the severity of COVID-19.[26,38] Furthermore, the study revealed a significant association among the count of WBCs and lymphocytes.
Thrombocytopenia, characterized by low platelet count, was observed in severe and critical COVID-19 patients in the present study. This finding is consistent with previous meta-analyses that have suggested a link between low platelet count and increased severity and mortality in COVID-19 patients.[42] Three possible mechanisms may explain the observed decrease in platelet count: Direct attack on hematopoietic stem cells in the bone marrow responsible for platelet production, immune system destruction of platelets, and micro-thrombi formation and platelet consumption in the lungs. Thus, thrombocytopenia can be considered a significant biomarker for determining the severity and mortality of COVID-19 patients.[43] In addition, a decrease in platelet count may be an indicator for recognizing the severity of coagulopathy.
In severe and critical COVID-19 patients, we observed an increase in neutrophil count compared to those with mild or moderate symptoms. This finding is consistent with the previous studies.[26,38,44] However, we did not observe any significant changes in other hematological parameters. We did find a significant increase (P < 0.001) in CRP levels in patients with moderate to severe and critical COVID-19, which is in line with the previous studies that linked elevated CRP values to COVID-19 progression.[45-48] We also found a strong positive correlation (r = 0.676) between CRP and WBCs, which agrees the previous findings.[49] Elevated levels of leukocytes and CRP can serve as a strong indicator of COVID-19 severity and play a role in prognosis. LDH levels were also found to be significantly elevated (140–280 U/L) in critically ill patients and can be used as an inflammatory biomarker in COVID-19 evaluation.[16,50-52] D-dimer levels were higher in severe COVID-19 patients, and high levels are linked to a higher risk of severity and can cause thrombotic complications, coagulopathy, and mortality.[53] Serum ferritin levels were also elevated in severe and critical COVID-19 patients, which may serve as a prognostic indicator for complications related to COVID-19, such as ARDS and coagulopathy.[54] These findings support the use of these biomarkers in evaluating and monitoring the severity of COVID-19.[42,54,55] Moreover, elevated levels of serum ferritin were observed in severe and critical COVID-19 patients compared to those with mild and moderate symptoms. This conforms to the results of a retrospective study by Zhou et al.,[56] who reported higher ferritin levels in the critical group among 301 individuals. Gao et al.[54] also found elevated ferritin levels in diabetic patients compared to nondiabetics. According to these authors, hyperferritinemia occurs due to the stimulation of cytokines associated with inflammation. High ferritin levels may be a prognostic indicator for complications related to COVID-19, such as ARDS and coagulopathy.[57,58]
CONCLUSION
Our study found that both RT-PCR and RAT diagnostic assays had comparable detection rates for COVID-19. However, RAT had fewer false positives and negatives and showed promise in healthcare settings. In addition, we identified several hematologic and inflammatory biomarkers, such as WBCs, differential leukocyte count, CRP, LDH, D-dimer, and serum ferritin, that were significantly associated (P < 0.001) with COVID-19 development and disease severity. These biomarkers can be used as prognostic indicators and aid in treatment planning for COVID-19 patients. Future research should explore the immunological mechanisms of these biomarkers at the metabolomics level and investigate the potential role of miRNAs as COVID-19 biomarkers for monitoring disease progression.
Acknowledgments
We thank Talha Medical Laboratory for giving us a platform and support in the entire research study.
Ethical approval
The ethics committee of the Department of Health and Biological Sciences, Abasyn University Peshawar, Khyber Pakhtunkhwa, Pakistan, approved the study. Approval number: 20FL-MPHIL-MB-18671 Dated: 14-05-2021.
Declaration of patient consent
The authors certify that they have obtained all appropriate patient consent.
Conflicts of interest
There are no conflicts of interest.
Use of artificial intelligence (AI)-assisted technology for manuscript preparation
The authors confirm that there was no use of artificial intelligence (AI)-assisted technology for assisting in the writing or editing of the manuscript and no images were manipulated using AI.
Financial support and sponsorship
Nil.
References
- NMR Spectroscopy Spotlighting Immunogenicity Induced by COVID-19 Vaccination to Mitigate Future Health Concerns. Curr Res Immunol. 2022;3:199-214.
- [CrossRef] [PubMed] [Google Scholar]
- Socioeconomic and Environmental Impacts of COVID-19 Pandemic in Pakistan-an Integrated Analysis. Environ Sci Pollut Res Int. 2021;28:19926-43.
- [CrossRef] [PubMed] [Google Scholar]
- SARS-CoV-2: Characteristics and Current Advances in Research. Virol J. 2020;17:117.
- [CrossRef] [PubMed] [Google Scholar]
- Coronavirus Disease 2019-Covid-19. Clin Microbiol Rev. 2020;33:e00028-20.
- [CrossRef] [PubMed] [Google Scholar]
- A Comprehensive Study of Sars-Cov-2: From 2019-Ncov to Covid-19 Outbreak. Microbiol Biotechnol Lett. 2020;48:252-66.
- [CrossRef] [Google Scholar]
- Elevations of Serum Cancer Biomarkers Correlate with Severity of COVID-19. J Med Virol. 2020;92:2036-41.
- [CrossRef] [PubMed] [Google Scholar]
- COVID-19 Biomarkers and Advanced Sensing Technologies for Point-of-Care (POC) Diagnosis. Bioengineering (Basel). 2021;8:98.
- [CrossRef] [PubMed] [Google Scholar]
- Pathophysiology, Transmission, Diagnosis, and Treatment of Coronavirus Disease 2019 (COVID-19): A Review. JAMA. 2020;324:782-93.
- [CrossRef] [PubMed] [Google Scholar]
- Clinical Characteristics of 138 Hospitalized Patients With 2019 Novel Coronavirus-Infected Pneumonia in Wuhan, China. JAMA. 2020;323:1061-9.
- [CrossRef] [PubMed] [Google Scholar]
- Outcomes for Patients with Covid-19 and Acute Kidney Injury: A Systematic Review and Meta-Analysis. Kidney Int Rep. 2020;5:1149-60.
- [CrossRef] [PubMed] [Google Scholar]
- The Optimal Diagnostic Methods for COVID-19. Diagnosis (Berl). 2020;7:349-56.
- [CrossRef] [PubMed] [Google Scholar]
- COVID-19 Diagnostic Approaches: Different Roads to the Same Destination. Virusdisease. 2020;31:97-105.
- [CrossRef] [PubMed] [Google Scholar]
- Current and Perspective Diagnostic Techniques for COVID-19. ACS Infect Dis. 2020;6:1998-2016.
- [CrossRef] [PubMed] [Google Scholar]
- Evolving Status of the 2019 Novel Coronavirus Infection: Proposal of Conventional Serologic Assays for Disease Diagnosis and Infection Monitoring. J Med Virol. 2020;92:464-7.
- [CrossRef] [PubMed] [Google Scholar]
- Comparison of Different Samples for 2019 Novel Coronavirus Detection by Nucleic Acid Amplification Tests. Int J Infect Dis. 2020;93:264-7.
- [CrossRef] [PubMed] [Google Scholar]
- Lactate Dehydrogenase Levels Predict Coronavirus Disease 2019 (COVID-19) Severity and Mortality: A Pooled Analysis. Am J Emerg Med. 2020;38:1722-6.
- [CrossRef] [PubMed] [Google Scholar]
- Correlation Analysis between Disease Severity and Inflammation-related Parameters in Patients with COVID-19: A Retrospective Study. BMC Infect Dis. 2020;20:963.
- [CrossRef] [PubMed] [Google Scholar]
- The Unique Characteristics of COVID-19 Coagulopathy. Crit Care. 2020;24:360.
- [CrossRef] [PubMed] [Google Scholar]
- Assessment of Serum Ferritin as a Biomarker in COVID-19: Bystander or Participant? Insights by Comparison with Other Infectious and Non-infectious Diseases. Biomarkers. 2020;25:616-25.
- [CrossRef] [PubMed] [Google Scholar]
- COVID-19 Gone Bad: A New Character in the Spectrum of the Hyperferritinemic Syndrome? Autoimmun Rev. 2020;19:102573.
- [CrossRef] [PubMed] [Google Scholar]
- Evaluation of the Role of Routine Laboratory Biomarkers in COVID-19 Patients: Perspective from a Tertiary Care Hospital in India. Indian J Clin Biochem. 2021;36:473-84.
- [CrossRef] [PubMed] [Google Scholar]
- Correlation of COVID-19 Severity with Hematological, Biochemical, Coagulation and Inflammatory Markers-A Cross-Sectional Study. Liaquat Med Res J. 2022;4:4.
- [CrossRef] [Google Scholar]
- COVID-19 Severity: Studying the Clinical and Demographic Risk Factors for Adverse Outcomes. PLoS One. 2021;16:e0255999.
- [CrossRef] [PubMed] [Google Scholar]
- Spatial Analysis of the Impact of Urban Geometry and Socio-demographic Characteristics on COVID-19, a Study in Hong Kong. Sci Total Environ. 2021;764:144455.
- [CrossRef] [PubMed] [Google Scholar]
- Oral Complications of ICU Patients with COVID-19: Case-Series and Review of Two Hundred Ten Cases. J Clin Med. 2021;10:581.
- [CrossRef] [PubMed] [Google Scholar]
- Evaluation of Hematological Parameters as an Indicator of Disease Severity in Covid-19 Patients: Pakistan's Experience. J Clin Lab Anal. 2021;35:e23809.
- [CrossRef] [PubMed] [Google Scholar]
- Age Groups that Sustain Resurging COVID-19 Epidemics in the United States. Science. 2021;371:eabe8372.
- [CrossRef] [PubMed] [Google Scholar]
- Comparative Analysis of Pediatric COVID-19 Infection in Southeast Asia, South Asia, Japan, and China. Am J Trop Med Hyg. 2021;105:413-20.
- [CrossRef] [PubMed] [Google Scholar]
- SARS-CoV-2: Characteristics and Current Advances in Research. Virol J. 2020;17:117.
- [CrossRef] [PubMed] [Google Scholar]
- Clinical Features of Patients Infected with 2019 Novel Coronavirus in Wuhan, China. Lancet. 2020;395:497-506.
- [CrossRef] [PubMed] [Google Scholar]
- Antigen-Detection in the Diagnosis of Sars-Cov-2 Infection Using Rapid Immunoassays: Interim Guidance Geneva: World Health Organization; 2020.
- [Google Scholar]
- Point-of-Care Evaluation of A Rapid Antigen Test (Clinitest® Rapid Covid-19 Antigen Test) For Diagnosis of Sars-Cov-2 Infection in Symptomatic and Asymptomatic Individuals. J Infect. 2021;82:E11-2.
- [CrossRef] [PubMed] [Google Scholar]
- Performance Characteristics of a Rapid SARS-CoV-2 Antigen Detection Assay at a Public Plaza Testing Site in San Francisco. medRxiv 2020
- [CrossRef] [Google Scholar]
- Performance of a Rapid Antigen Test for SARS-CoV-2 in Kenya. Diagn Microbiol Infect Dis. 2022;102:115591.
- [CrossRef] [PubMed] [Google Scholar]
- Estimating Epidemiologic Dynamics from Cross-sectional Viral Load Distributions. Science. 2021;373:eabh0635.
- [CrossRef] [PubMed] [Google Scholar]
- High Proportion of Low Cycle Threshold Value as an Early Indicator of COVID-19 Surge. J Med Virol. 2022;94:240-5.
- [CrossRef] [PubMed] [Google Scholar]
- SARS-CoV-2 cycle threshold (Ct) values predict future COVID-19 cases. J Clin Virol. 2022;150:105153.
- [CrossRef] [PubMed] [Google Scholar]
- Differential White Blood Cell Count in the COVID-19: A Cross-sectional Study of 148 Patients. Diabetes Metab Syndr. 2020;14:2099-102.
- [CrossRef] [PubMed] [Google Scholar]
- Trends in HIV-2 Diagnoses and Use of the HIV-1/HIV-2 Differentiation Test-United States, 2010-2017. MMWR Morb Mortal Wkly Rep. 2020;69:63-6.
- [CrossRef] [PubMed] [Google Scholar]
- Hematological Manifestations of COVID-19. Leuk Lymphoma. 2020;61:2790-8.
- [CrossRef] [PubMed] [Google Scholar]
- High Expression of ACE2 Receptor of 2019-nCoV on the Epithelial Cells of Oral Mucosa. Int J Oral Sci. 2020;12:8.
- [CrossRef] [PubMed] [Google Scholar]
- Thrombocytopenia is Associated with Severe Coronavirus Disease 2019 (COVID-19) Infections: A Meta-analysis. Clin Chim Acta. 2020;506:145-8.
- [CrossRef] [PubMed] [Google Scholar]
- Laboratory Findings of COVID-19: A Systematic Review and Meta-analysis. Scand J Clin Lab Invest. 2020;80:441-7.
- [CrossRef] [PubMed] [Google Scholar]
- The Clinical Implication of Dynamic Neutrophil to Lymphocyte Ratio and D-dimer in COVID-19: A Retrospective Study in Suzhou China. Thromb Res. 2020;192:3-8.
- [CrossRef] [PubMed] [Google Scholar]
- C-reactive Protein as an Early Predictor of COVID-19 Severity. J Med Biochem. 2020;39:500-7.
- [CrossRef] [PubMed] [Google Scholar]
- Laboratory Parameters in Detection of COVID-19 Patients with Positive RT-PCR; a Diagnostic Accuracy Study. Arch Acad Emerg Med. 2020;8:e43.
- [Google Scholar]
- Biomarkers Associated with COVID-19 Disease Progression. Crit Rev Clin Lab Sci. 2020;57:389-99.
- [CrossRef] [PubMed] [Google Scholar]
- Laboratory Features of Severe vs. Non-severe COVID-19 Patients in Asian Populations: A Systematic Review and Meta-analysis. Eur J Med Res. 2020;25:30.
- [CrossRef] [PubMed] [Google Scholar]
- Serum Troponin, D-dimer, and CRP Level in Severe Coronavirus (COVID-19) Patients. Immun Inflamm Dis. 2022;10:e582.
- [CrossRef] [PubMed] [Google Scholar]
- Evaluation of Biochemical Characteristics of 183 COVID-19 Patients: A Retrospective Study. Gene Rep. 2022;26:101448.
- [CrossRef] [PubMed] [Google Scholar]
- Identification of Severe Acute Respiratory Syndrome in Canada. N Engl J Med. 2003;348:1995-2005.
- [CrossRef] [PubMed] [Google Scholar]
- Clinical and Laboratory Features of Severe Acute Respiratory Syndrome Vis-a-Vis Onset of Fever. Chest. 2004;126:509-17.
- [CrossRef] [PubMed] [Google Scholar]
- Elevated D-dimer Levels on Admission are Associated with Severity and Increased Risk of Mortality in COVID-19: A Systematic Review and Meta-analysis. Am J Emerg Med. 2021;39:173-9.
- [CrossRef] [PubMed] [Google Scholar]
- Diagnostic Utility of Clinical Laboratory Data Determinations for Patients with the Severe COVID-19. J Med Virol. 2020;92:791-6.
- [CrossRef] [PubMed] [Google Scholar]
- D-dimer is Associated with Severity of Coronavirus Disease 2019: A Pooled Analysis. Thromb Haemost. 2020;120:876-8.
- [CrossRef] [PubMed] [Google Scholar]
- A Pneumonia Outbreak Associated with a New Coronavirus of Probable Bat Origin. Nature. 2020;579:270-3.
- [CrossRef] [PubMed] [Google Scholar]
- Relationship between Ferritin Levels and the Prognosis of Covid-19. Rev Med (São Paulo). 2022;101:1-12.
- [CrossRef] [Google Scholar]
- Elevated Serum Ferritin Level Effectively Discriminates Severity Illness and Liver Injury of Coronavirus Disease 2019 Pneumonia. Biomarkers. 2021;26:207-12.
- [CrossRef] [PubMed] [Google Scholar]