INTRODUCTION
The human cervix has been shown to be a dynamic organ through out the gestation, varying markedly in both size and length. [1] As term approaches, the cervix begins to shorten, in association with effacement and dilatation. This may be favourable occurrence in successful human parturition, but if occurs early leads to preterm morbidity. Though are there are attempts to monitor serial cervical changes during pregnancy by digital assessment of cervix, it has been flawed by subjectivity and as such pervaginal examination assesses only vaginal portion of the cervix. [2] Outcomes of several studies have indicated that ultrasound has an immense value in antenatal cervical surveillance. [3,4]
Monitoring cervical dimensions during pregnancy helps in the prediction of risk of preterm labor resulting in early diagnosis and institution of preventive therapy such as encirclage, tocolysis and prophylactic steroids. [3,4] Transvaginal sonography has been widely used because, unlike transabdominal sonography, it is not affected by maternal obesity, oligoamnios, bladder filling, attenuated echoes of the fetal head or artificially lengthened cervical dimensions caused by bladder compression. [5] The use of serial transvaginal cervical monitoring has shown that progressive changes in the cervix detectable at transvaginal ultrasound examination precede the onset of preterm labour over a period of a time. [6]
There are conflicting reports regarding the pattern of cervical changes with advancing gestational age in relation to parity, maternal obesity and ethnicity. In general many studies have shown that cervix bears an inverse relation to gestational age in length and direct relation with regard to width. [7-11] Studies based on cross sectional data have demonstrated wide variation, due to different study populations, methodologies and analyses. [11-13] Some recent studies have demonstrated that cervical length in pregnant Asian women is different from that of Western women. [7, 11, 14, 15] This might be related to body weight, height or race. [7] Consequently, reference values from Western studies might not be generalizable and applicable to Indian women.
There are few published studies on measurements obtained in Asian women. [7, 14] Serial measurements are more appropriate for cervical dynamic assessments in pregnancy. Therefore, the aim of this study was to assess the serial cervical dimensions at 20, 24, 28, 32, 36 and 37+ weeks gestation by transvaginal sonography in a mixed population of nulliparous and parous South Indian women and to establish a reference range for cervical length measurement from mid-pregnancy till delivery.
MATERIALS AND METHODS
This was a prospective randomised longitudinal study involving fifty pregnant women done in the Department of Obstetrics and Gynecology at Dr. T. M. A. Pai Hospital, Udupi from June 2003 to May 2004. This hospital serves as one of the teaching hospitals in maternity for undergraduate and postgraduate students studying at Kasturba Medical College, Manipal.
All the patients were recruited in the second trimester at 20 weeks of gestation at the time of routine prenatal screening for congenital anomalies. Gestational age was determined from the menstrual history and confirmed from the first-trimester scan. When the difference between the two estimates was more than seven days the first trimester ultrasound result (based on Crown Rump Length - CRL) was used for dating.
The inclusion criterion was singleton live pregnancies regardless of parity and bad obstetrics history. The exclusion criteria were as follows:
- History of first trimester bleeding
- Presence of uterine malformations and leiomyoma
- Presence of Pregnancy Induced Hypertension, Gestational diabetes and other medical disorders such as renal disease, essential hypertension which may influence gestational age at delivery
- Multiple pregnancy, low lying placenta and hydramnios
- Ultrasound findings suggestive of cervical incompetence
Before proceeding to transvaginal ultrasound, the woman was asked to empty the bladder. With patient in lithotomy position, 5 MHz vaginal probe was introduced into the vagina and the length & width of the cervix was measured with the probe placed in the anterior fornix of the vagina. The appropriate sagital view of cervix was obtained by simultaneous imaging of external and internal os. External os was identified by its triangular echo density and internal os by its V - shape appearance. The cervical canal was seen as a translucent line connecting these two points. The distance between the external and internal os was taken as cervical length. The width was measured at the level of internal os. All these measurements were repeated thrice and the averaged readings were taken for statistical analysis. These measurements were repeated every four weeks till delivery. To reduce the interobserver variability and improve reproducibility of cervical measurements using transvaginal ultrasound the following criteria were adopted:
- The internal os is visualized as a flat dimple or an isosceles triangle
- The whole length of the cervix is visualized
- The external os appears symmetric
- The distance from the surface of the posterior lip to the cervical canal is equal to the distance from the surface of the anterior lip to the cervical canal
- Transducer pressure on the cervix is kept to minimum
- The widest viewing angle of available ultrasound field should be used [2]
RESULTS
The incidence of spontaneous preterm births was 8% (4/50) in the present study. The mean maternal age of the study population was 24.3 ± 3.8 years (range 17 - 36), and 52% (26) of the women were primigravidae and 48% (24) multigravidae. Maternal weight varied from 37 kg to 68 kg (mean 53 kg ± 9.1 kg). Nine women had BMI of more than BMI of 23 kg/m2 Mean gestational age at the time of ultrasonographic cervical length measurement was 20.2 ± 1.4 weeks (range 18 - 22) and mean gestational age at birth was 38.5 ± 2.8 weeks (range 33 - 41). Preterm delivery (before 37 weeks) occurred in four women (one delivered at 34 weeks, two delivered at 35 and one at 36 weeks) and 92% (n=42) delivered after 37 weeks of gestation.
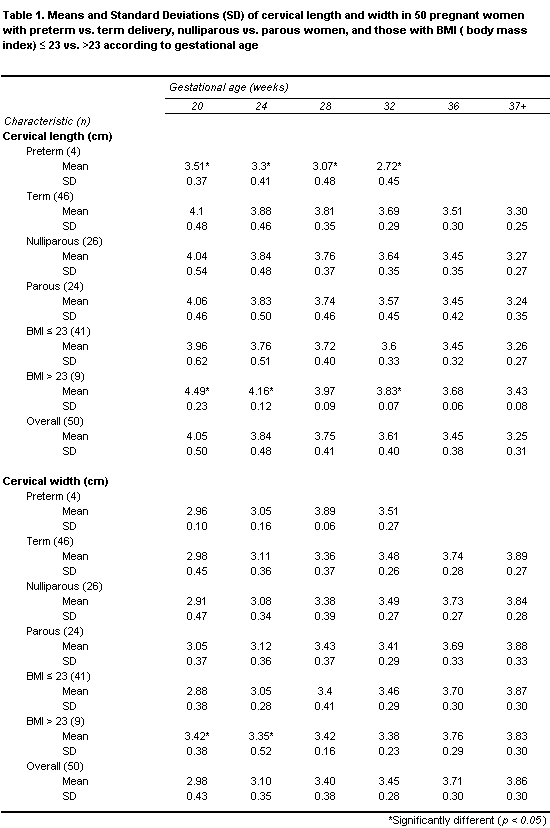
The mean and SD of cervical length and width at each gestational age in women with preterm vs. term delivery, in nulliparous vs. parous women, and in those with prepregnancy BMI < 23 vs. >23 are shown in Table 1. Cervical lengths in women who delivered preterm (< 37 weeks) were significantly shorter compared to term delivery group, but such a difference was not observed with cervical width measurements. Cervical lengths and widths did not differ significantly between primigravidae and multigravidae. However the cervical lengths and widths were significantly longer in women with high BMI (> 23 kg/m2) at 20th and 24th week, but as the pregnancy advanced this difference disappeared.
 |
Percentile values of cervical length and width at 20, 24, 28, 32, 36 and term gestation are shown in Table 2. Overall, mean cervical lengths decreased while mean cervical widths increased with the gestational age.
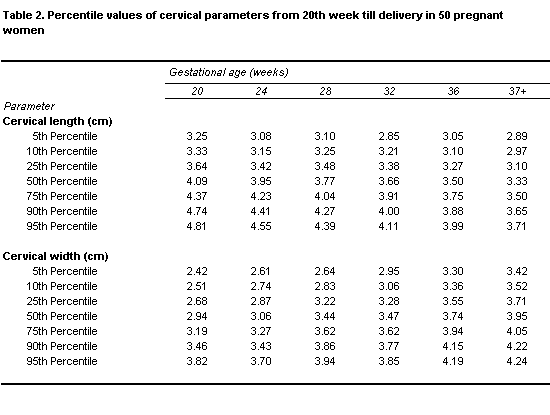 |
Table 3 shows results of multivariate regression analysis. It was found that gestational age and body mass index significantly influenced cervical parameters: both length and width, but not the parity. As statistical analysis showed length had more variation than the width, further graphical interpretation was carried out keeping mainly cervical length in view.
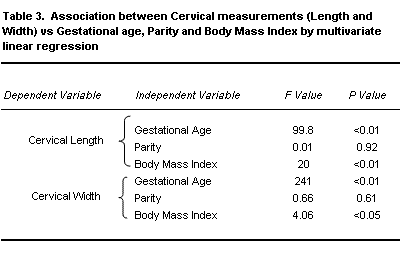 |
Figure 1 represents pattern of change in cervical length and width with increasing gestational age. Regression analysis showed 0.35 mm decrease in cervical length and 0.46 mm increase in cervical width for every week of gestation showing opposite trends.
Regression equations for cervical length and width in the present study are given below:
Cervical Length (CM) = (-0.0347 x Gestational Age in weeks) + 4.7158
(Regression coefficient constant (β) = -0.0347, r = 0.505, F =99.8, p < 0.001)
Cervical Width (CM) = (0.0462 x Gestational Age in weeks) + 2.0385
(Regression coefficient constant (β) = 0.0462, r = 0.675, F =241, p <0.001)
The linear regression coefficient represents the weekly change in cervical dimensions in cm. The negative coefficient implies inverse relation.
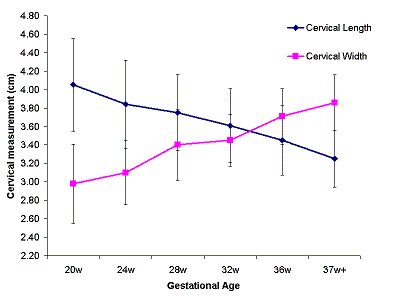 |
Figure 2 shows cervical length changes in term and preterm groups. Significant cervical shortening occurred in those who delivered preterm through out the gestation. Linear regression analysis showed that the rate of cervical length reduction was significantly higher in preterm delivery group compared to term delivery group (0.65 mm vs. 0.37 mm per week of gestation, p < 0.0001).
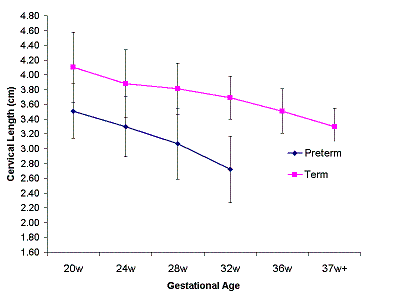 |
Figure 3 shows cervical changes according to parity. Cervical length decreased as gestation advanced in both the groups. It was also observed that there was no statistical difference between the two groups (F= 0.66, p = 0.41) regarding the pattern of change implying that the change is almost identical in both primigravidae and multigravidae.
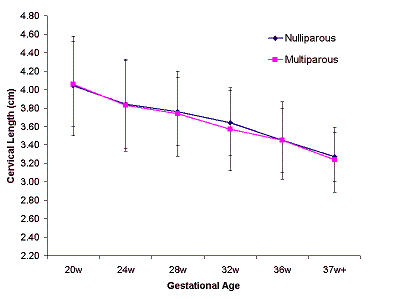 |
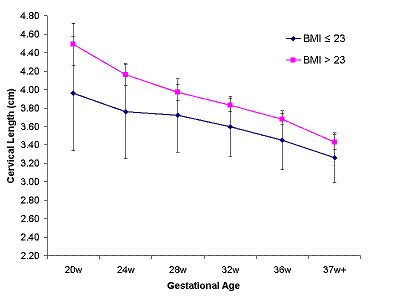
Figure 4 shows influence of Body Mass Index on cervical length. It was observed that mean cervical length at any given gestation was longer in patients with BMI > 23, however this was statistically significant only in the beginning (at 20th and 24th week of gestation).
 |
DISCUSSION
This research focuses mainly on a longitudinal study of both cervical length and width during pregnancy using transvaginal sonography. The advantage with transvaginal approach is that it provides a very clear picture of the cervix in nearly all cases. The acceptability rate among patients is high, more than 90% report none or only mild discomfort or embarrassment during the procedure. [16]
In the present study, the mean cervical length decreased gradually from 4.05 cm from 20th week to 3.25 cm at term. The equivalent values were 2.98 cm and 3.86 cm for cervical width showing opposite trend. The cervical length measurement results are in agreement with Yu H (1999) who examined 131 Chinese singleton pregnancies longitudinally during pregnancy and reported that cervical length decreased from 3.23 cm to 2.58 cm. [17] The pattern is similar to our study but on and average 6-8 mm shorter than our finding of cervical length. Bergelin and Valentin (2003) from Sweden reported that cervical width was 3.5 cm at 24th week of gestation and it increased to 4.8 cm at term. [18] Though the pattern is similar to present study, the absolute values are higher and it may be due to variation in constitution. The same group observed three patterns of cervical length changes; a continuous decrease, an accelerated shortening after approximately 30 gestational weeks and a sudden drop in length in the third trimester. However in our study, we observed only the first two patterns; a gradual decrease in those who delivered term and an accelerated decrease in those who delivered preterm.
Our study did not show any relation between parity and cervical dimensions. Gramellini et al (2002) reported similar finding in their cross sectional study involving 321 subjects. [19] They showed that cervical length was comparable in nulliparous and parous women throughout pregnancy and shows a progressive, linear reduction between the 10th and 40th weeks in both the groups. But some studies have reported that cervices of parous women are thicker and lengthier. [12, 13] They have attributed it to the fact that elastin, collagen and water content of parous cervices is different than nulliparous cervices because of changes that the cervix undergoes after delivery.
It is a known fact that maternal weight is one of the important determinants of low birth weight (LBW). Several studies have indicated that preterm delivery rate is higher among those who have low BMI (Body Mass Index). The Preterm Prediction Study Group (2005) of National Institute of Child Health and Human Development, Bethesda, USA studied association between maternal body mass index and gestational age at delivery. They reported that cervical length measurements are higher in those women with high body mass index and they have lower incidence of preterm delivery and concluded that maternal obesity has protective action on preterm incidence. [20] One Brazilian study (2004) involving 1131 patients reported that mean cervical length in women with low BMI was significantly lower compared to subjects with normal or high BMI. [21] In our study, cervical length of women with a BMI of more than 23 kg/m2 was longer than those with a BMI of 23 kg/m2 or less.
We have established nomogram of cervical dimensions throughout pregnancy. Our charts for cervical length in pregnant population can be used for observing patients at high risk of preterm delivery and for clearly identifying a significant deviation or decline in the percentile for these subjects. Thus we are of the opinion that sonographic cervical length surveillance initiated early in gestation and continued through out the pregnancy may identify the women whose cervices shorten at a higher rate. These women could then be appropriately counseled and available management options such as bed rest, tocolyis, prophylactic dexamethasone and timely referral to tertiary centers are discussed. These interventions may prove to be effective in the reduction of preterm births and associated morbidity.
ACKNOWLEDGEMENT
This study was supported by a grant from Research fund for Postgraduate studies from Manipal Academy of Higher Education (MAHE).
REFERENCES
-
Leppert PC. Anatomy and physiology of cervical ripening. Clin Obstet Gynecol 1995;38(2):267-79.
-
Sonek JD, Iams JD, Blumenfeld M, et al. Measurement of cervical length in pregnancy. Comparison between vaginal ultrasonography and digital examination. Obstet Gynecol 1990;76:172-5.
-
Andersen HF, Nugent CE, Wanty SD, et al. Prediction of risk for preterm delivery by ultrasonographic measurement of cervical length. Am J Obstet Gynecol 1990;163:859-67.
-
Gomez R, Galasso M, Romero R, et al. Ultrasonographic examination of the uterine cervix is better than cervical digital examination as a predictor of the likelihood of premature delivery in patients with preterm labor and intact membranes. Am J Obstet Gynecol 1994;171:956-64.
-
To MS, Skentou C, Cicero S, et al. Cervical assessment at the routine 23-weeks' scan: problems with transabdominal sonography. Ultrasound Obstet Gynecol 2000 Apr;15(4):292-6.
-
Lorenz RP, Comstock CH, Bottoms SF, et al. Randomized prospective trial comparing ultrasonography and pelvic examination for preterm labor surveillance. Am J Obstet Gynecol 1990;162:1603-10.
-
Kushnir O, Vigil DA, Izquierdo L, et al. Vaginal ultrasonographic assessment of cervical length changes during normal pregnancy. Am J Obstet Gynecol 1990;162:991-3.
-
Zorzoli A, Soliani A, Perra M, et al. Cervical changes throughout pregnancy as assessed by transvaginal sonography. Obstet Gynecol 1994;84:960-4.
-
Brieger GM, Ning XH, Dawkins RR, et al. Transvaginal sonographic assessment of cervical dynamics during the third trimester of normal pregnancy. Acta Obstet Gynecol Scand 1997;76:118-22.
-
Hoesli IM, Strutas D, Tercanli S, et al. Charts for cervical length in singleton pregnancy. Int J Gynaecol Obstet 2003 Aug;82(2):161-5.
-
Tongsong T, Kamprapanth P, Pitaksakorn J. Cervical length in normal pregnancy as measured by transvaginal sonography. Int J Gynecol Obstet 1997;58:313-5.
-
Iams JD, Goldenberg RL, Meis PJ, et al. The length of the cervix and the risk of spontaneous premature delivery. N Engl J Med 1996;334:567-72.
-
Cook CM, Ellwood DA. A longitudinal study of the cervix in pregnancy using transvaginal ultrasound. Br J Obstet Gynaecol 1996;103:16-8.
-
Murakawa H, Utumi T, Hasegawa I, et al. Evaluation of threatened preterm delivery by transvaginal ultrasonographicmeasurement of cervical length. Obstet Gynecol 1993;82:829-32.
-
Ayers JW, DeGrood RM, Compton AA, et al. Sonographic evaluation of cervical length in pregnancy: diagnosis and management of preterm cervical effacement in patients at risk for premature delivery. Obstet Gynecol 1988;71:939-44.
-
Heath VC, Southall TR, Souka AP, et al. Cervical length at 23 weeks of gestation: prediction of spontaneous preterm delivery. Ultrasound Obstet Gynecol 1998;12:312-7.
-
Yu H, Li W, Yang T. Sonographic measurement of uterine cervix in pregnancy. Hua Xi Yi Ke Da Xue Xue Bao. 1999 Jun;30(2):208-9.
-
Bergelin I, Valentin L. Cervical changes in twin pregnancies observed by transvaginal ultrasound during the latter half of pregnancy: a longitudinal, observational study. Ultrasound Obstet Gynecol 2003 Jun;21(6):556-63.
-
Gramellini D, Fieni S, Molina E, et al. Transvaginal sonographic cervical length changes during normal pregnancy. J Ultrasound Med 2002 Mar;21(3):227-32.
-
Hendler I, Goldenberg RL, Mercer BM, et al. The Preterm Prediction Study: association between maternal body mass index and spontaneous and indicated preterm birth. Am J Obstet Gynecol 2005 Mar;192(3):882-6.
-
Palma-Dias RS, Fonseca MM, Stein NR, et al. Relation of cervical length at 22-24 weeks of gestation to demographic characteristics and obstetric history. Braz J Med Biol Res. 2004 May;37(5):737-44.