INTRODUCTION
Liver cirrhosis is one among the leading causes of death in the world and continues to represent a significant worldwide healthcare burden [1], estimated to have caused around 25,000 deaths in the United States in 1997 [2]. The etiologies of liver cirrhosis are various and among them are drug induced cirrhosis or cirrhosis due to certain infections such as Hepatitis B and C. Pathological conditions such as biliary atresia, cystic fibrosis, gallstones, may also account for cirrhosis in certain conditions. Cirrhosis can be classified in three categories, according to the Child’s- Pugh classification, depending on the severity of the disease [1]. Liver cirrhosis is accompanied by a host of complications, specially the hepatorenal syndrome, causing retention of sodium and free water, decrease in renal perfusion and GFR [3], thereby leading to edematic, and ascitic conditions.
Frusemide, a loop diuretic acting on the Na+/K+/2Cl- symport in the luminal membrane of the ascending loop of Henle, inhibits the chloride and sodium reabsorption, but has no effect on the distal nephron [4]. It has been routinely used for the long term treatment of ascites in cirrhotic patients. Frusemide is an organic acid which is 96-98% plasma bound thereby limiting its delivery to the site of action. Pre-systemic metabolism of frusemide is carried out by the intestine while systemic clearance of frusemide is mainly performed by the kidneys with contributions from the intestine and the liver [5]. Since 30-50% of filtered sodium is reabsorbed in the loop of Henle using this transport system, frusemide has high natriuretic properties. At high dosage it may also increase sodium excretion up to 30%.
Presence of edema, due to renal malfunctioning, in cirrhosis, increases volume of distribution, altering drug bioavailability. In severe proteinuria, higher dosage of frusemide is required to achieve adequate free drug concentrations given that urinary albumin binds frusemide and reduces its effectiveness. Clinical non-responders tend to have a decreased fraction of loop diuretics excreted in urine, thereby predisposing them to the side effects of frusemide. Frusemide though not being significantly metabolized by liver may lead to severe side effects such as hyperuricaemia, electrolyte disturbances such as hypokalaemia and the hepatorenal syndrome observed in cirrhotic patients [6]. Furthermore, genetic traits, inter population variations and environmental factors may also significantly contribute to variability in drug response and disposition, thereby leading to a major clinical problem [7, 8]. Kinetics of frusemide have been earlier reported in both compensated and decompensated cases of liver cirrhosis, but reported studies were mainly carried out in Western population, using either intravenous frusemide or at a dose of 80-120 mg orally. However, no studies have been reported on the kinetics of 40 mg oral frusemide among Indian subjects.
The current study has been carried out among healthy and cirrhotic Indian subjects, with the aim to assess the pharmacokinetic parameters of 40 mg oral frusemide and to compare the generated kinetic data with earlier reported studies.
METHODOLOGY
Patient recruitment
The study population included 24 cirrhotic patients. The cause and diagnosis of cirrhosis was identified based on clinical, biochemical and histological findings. Physical examination, nutritional status assessment including serum albumin, BMI, and Child’s Pugh’s Classification were determined. Recruited patients did not have any other diagnosed disease and no history of fresh internal bleeding. Prior to start of the study, patients were asked to stop frusemide intake 48 hrs prior to start of the test.
Volunteer recruitment
12 male volunteers in the age group of 24-29 years were recruited. Health status was ascertained by carrying out various biochemical tests, immunological tests and hematological examinations.
Collection of study sample
Prior to start of the study, all subjects were fasted overnight but water intake was allowed. The cirrhotic and the healthy volunteers, all had 40 mg of oral frusemide and blood samples were collected in heparinised tubes at specified time intervals following drug administration, up to six hours. Blood samples were centrifuged at 4000 rpm for 5 mins, the supernatant withdrawn and stored in Eppendorf tubes at -20°C till the analysis.
Reagents
Frusemide (99.9%) purity was kindly donated by Aventis Pharma Ltd, India. Acetonitrile (HPLC grade) and Methanol (HPLC grade) were purchased from s.d fine chemical ltd India. Milli Q water was obtained from Millipore water systems, at a filter size of 0.22 µm. All solutions were degassed under vacuum before use. Glacial acetic acid (HPLC grade), HCl and NaOH pellets, were all brand products of Merck Ltd. The mobile phase consisted of a mixture of ACN-0.01 M sodium acetate, which was prepared by mixing ACN and degassed milli-q water in a ratio of 25:75. PH was adjusted to 5.0 with 4.0 M NaOH. The final mixture was degassed under vacuum before use.
Instrument used
The HPLC instrument consisted of a 515 Waters (USA) pump and UV detector. The column was a 30 cm × 3.9 mm µ Bondapack C18 reversed phase column, particle size 10 µM (Waters Assoc). The whole system was controlled by a Millenium Version 2000 Unix computer programming system. The flow rate was adjusted at 2.0 ml/min at an ambient temperature. The detection was followed by using a simple UV lamp detector calibrated at 280 nm. The pressure varied between 1812-2012 psi. Retention times were 5.0 mins and total run time was 10 mins.
Pharmacokinetic parameters
Concentration time curves of frusemide in plasma were drawn, where values of Cmax and tmax were extrapolated. The area under curve (AUC) was determined by trapezoidal rule. Value of ß (elimination constant) was calculated from the elimination phase of the concentration time curve, using the following equation:
ß =-2.3 log (Y2-Y1)/(X1-X2)
(Where, Y2 and Y1 are the concentration values corresponding to the Y axis, and X1 and X2 are the time intervals corresponding to the X axis.)
Volume of distribution (Vd) was calculated using the following formula:
Vd =Dose/(AUC.ß)
Systemic clearance (Cls) was determined by:
Cls =Dose/AUC
RESULTS
Area Under Curve (AUC)
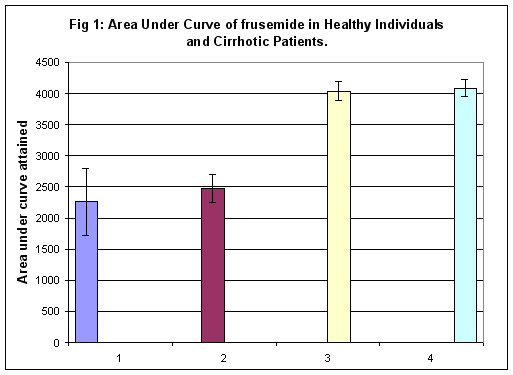
In healthy volunteers, the AUC, representing the concentration of frusemide present in plasma, was 2258 ± 530.7 ng/ml hr. In groups A, B and C cirrhosis, corresponding values were 2471 ± 228.65, 4038 ± 154.7 and 4085 ± 131.75 ng/ml hr respectively (Figure 1). The difference in AUC between volunteers and group A patients was not statistically significant. However, AUC difference between healthy volunteers and groups B and C patients was statistically significant at 1% (p<0.01). Significant differences were also observed in AUC for groups B and C vis a vis group A (p<0.01). No statistical difference in AUC was observed between groups B and C of patients.
 |
Volume of distribution (Vd)
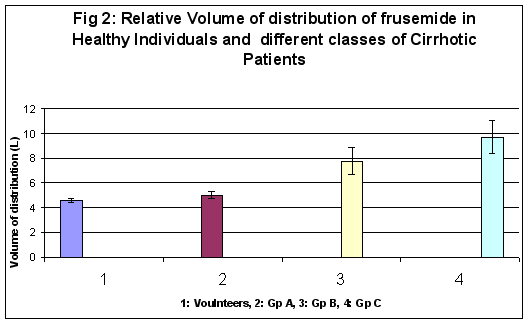
Mean volume of distribution (Vd) in volunteers and group A, B and C cirrhosis were respectively 4.56 ± 0.15 L, 5.00 ± 0.31 L, 7.73 ± 1.10 L and 9.69 ± 1.32 L. There was no statistical difference between healthy volunteers and group A patients. However, statistical significance was observed between volunteers and B and C group of cirrhosis (p<0.01). Significant differences were also observed between A and C group of cirrhotics at 5% (p<0.05). No significant differences were observed between groups B and C. (Figure 2)
 |
Systemic clearance (CLs)
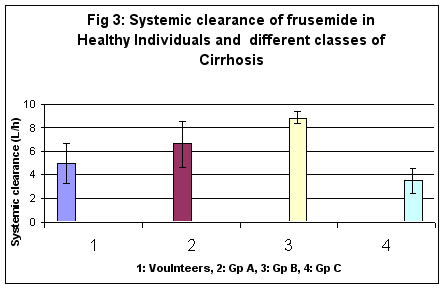
In healthy subjects systemic clearance (CLs) was calculated to be 4.97 ± 1.67 l/h, and 6.60 ± 2.90, 8.84 ± 0.45, and 3.49 ± 1.40 l/h respectively in Child’s A, B and C cirrhosis. Clearance increased significantly among cirrhotics in comparison to volunteers (p<0.05). However in C group of cirrhosis, systemic clearance decreased considerably. (Figure 3)
 |
Mean Maximum Plasma Concentrations of Frusemide (Cmax)
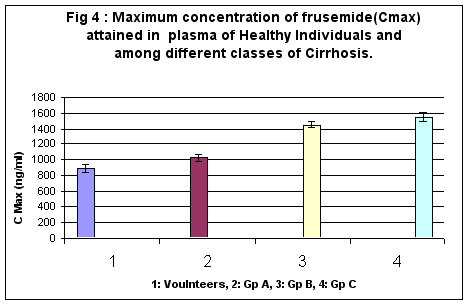
Maximum plasma frusemide concentration attainable in healthy volunteers was calculated at 892 ±49.4 ng/ml, whereas in the various categories of Childs classification, they were respectively 1021 ± 47.97, 1448 ± 43.20, 1551 ± 59.02 ng/ml. Whereas no significant difference was observed between healthy subjects and A group of cirrhosis, B and C groups of cirrhosis demonstrated significant difference in Cmax values vis a vis volunteers (p<0.01). (Figure 4)
 |
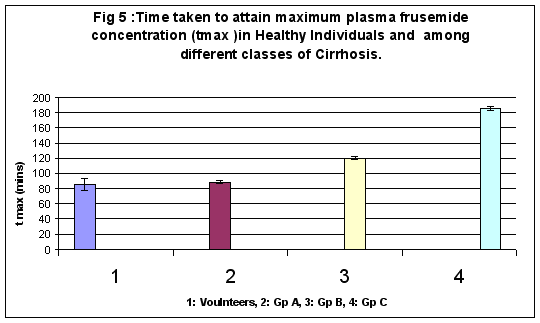
Time taken to attain Maximum Plasma Concentration (tmax)
tmax values in healthy volunteers and in groups A, B and C of cirrhosis were as follows: 85.20 ± 7.49, 88.25 ± 2.12, 120 ± 1.89 and 185.7 ± 2.68 minutes respectively. Group A and volunteers displayed no significant difference in t max values, however, significant differences at 1% were observed between B and C group of cirrhosis. (Figure 5)
 |
DISCUSSION
Liver cirrhosis highly influences the dynamic state of the human body. Earlier reports have suggested altered kinetics of a spectrum of drugs such as fluconazole [9], omeprazole [10] and a host of other drugs, which are generally administered during cirrhosis. Several kinetic studies in cirrhosis have been conducted, but there has been no conclusive study on the three types of cirrhosis and also kinetic studies among Indian population. The objectives of this study was to shed light on the kinetics of frusemide among healthy and three types of cirrhosis among Indian population and evaluate any possible deviations from the reported studies.
The kinetics of frusemide among Indian volunteers was not in accordance to previously reported data generated from healthy individuals. Earlier reported tmax values ranged between 60-70 mins [11] and 100-150 mins after 40 mg and 80 mg of oral frusemide respectively in healthy volunteers. In the current study, the tmax value among Indian volunteers was observed to be 90 mins. The volunteers had fasted overnight, but some had breakfast after drug administration. Since food tends to retard kinetics of frusemide [12], this might have possibly led to observed increase in tmax value. However, the increase in tmax could also be due to slow absorption kinetics amongst Indian Subjects. Current calculated Cmax value (0.904 ± 0.452 ng/ml) in healthy volunteers was lower than earlier reported values [11], which could be explained to the difference in administered dose of frusemide (40 mg v /s 80 mg). Bioequivalence could also be affected by the nature of formulations used [13]. Correspondingly, mean area under curve (2.23 ± 0.5 mg/ml h) were lower among Indian volunteers in view of the lower Cmax and tmax values. The mean half-life values reported are divided on this issue. Higher mean half- life values have been reported elsewhere, but studies conducted by Rupp et al [14] and Cutler et al [15] have reported similar values as observed in our study. Age [16], study design [17], analytical methods and drug formulation [18] may also alter the course of the drugs in the body, thereby explaining the difference in the observed difference in trend.
Among the cirrhotic groups, observed kinetic parameters were not in accordance to earlier reported values. The Cmax and tmax in our study increased proportionally in categories A, B and C of cirrhosis vis a vis healthy volunteers. The increase in tmax is due to presence of edema of the gut along with changed motility, which is predominant in cirrhosis [19]. It is also reported that cirrhosis causes prolongation of gastric emptying time (GET), leading to delayed absorption and thereby raising Cmax and tmax [20, 21]. However, current Cmax and tmax could not be compared to earlier reports, due to non availability of data on these parameters.
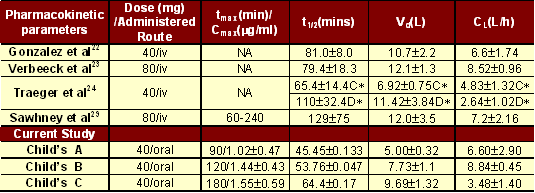
Current observed mean AUC increased in parallel with severity of disease. The increase in AUC among the three type of cirrhosis could be explained due to decreased serum albumin level, hence affecting its binding to frusemide. The increase in AUC level could also be due to decreased systemic clearance, responsible for the observed increase in volume of distribution and half-life. The drug clearance in Group C is also further significantly reduced owing to a decrease in systemic clearance. The volume of distribution reported earlier [22-24] correlated to some extent to that observed in our group C patients. This indicates that earlier studies might have been specifically conducted among Child’s C cirrhotics. The mean albumin levels among cirrhotics (3.55 ± 0.34 group A, 3.08 ± 0.22 group A, and 2.54 ± 0.22 group C mg% respectively) in the current study were lower in comparison to volunteers (4.75 ± 0.25). It has been earlier reported that a decrease in protein binding [25] causes an increase in Vd, thereby justifying the increase in the volume of distribution among cirrhotics. Similar trend in volume of distribution has been reported with lidocaine [26], diazepam [27] and ampicillin [28] among cirrhotic patients. Current Vd increase in our group C patients, could also be due to the possible development of ascites during the course of the study. Our data of Vd correlate with earlier reports, suggesting that earlier studies might have explored kinetics of frusemide in group C patients. Most data sources available, do not distinguish between the types of diabetes, thereby rendering comparison with earlier studies difficult.
Reports on the systemic clearance (CL) illustrative of the drug clearance from the body were variable (Table 1). Whereas some studies have reported decreased frusemide clearance among cirrhotic patients [22, 23, 29] others have reported high clearance rate in compensated cirrhosis, and no difference in decompensated groups [24]. Earlier reports did not mention about the stages of cirrhosis, thereby making it difficult to compare currently calculated values. As volume of distribution is inversely proportional to CL, our observations are justified by the observed increase in volume of distribution with a paralleled decrease in systemic clearance among the three types of cirrhosis.
 |
Currently observed increase in systemic clearance among A and B groups of cirrhosis vis a vis healthy volunteers indicates compensated stage. Compensated stage is expressed by a compensatory increase in renal excretion of unchanged drug, due to insufficient detoxification capabilities of the liver [24]. The relatively decreased systemic clearance of the drug in group C cirrhosis may also be the result of higher age of patients in that category and hence their associated dwindling renal functions (Nielsen 1973). It is also reported [25] that cirrhotics have essentially no non renal frusemide elimination.
CONCLUSION
Current kinetic parameters among healthy Indian volunteers do not correspond to the earlier reports carried out mainly in Western countries. Such differences may be explained on various basis such as the difference in techniques, aging, sample selection, etc as explained above, but a certain genetic interplay influencing drug disposition should not be ruled out. Genetic differences is becoming commonly known and there are various approaches to create a ‘tailor made’ to reduce economic drug and curtail side effects.
REFERENCES
- Williams EJ, Iredale JP. Liver cirrhosis. Postgraduate Medical Journal. 1998 Apr;74(870):193-202.
- Cirrhosis: Hispanic Risk. About Alcoholism and Substance Abuse. Retrieved from http://alcoholism.about.com/library/blnaanews010920.htm
- Gines P, Fernandez-Esparrach G, Arroyo V. Ascites and renal functional abnormalities in cirrhosis. Pathogenesis and treatment. Baillieres Clin Gastroenterol. 1997 Jun;11(2):365-85.
- Puschet JB, Winaver J. Effects of diuretics on renal function. Handbook of physiology. Oxford Universoty Press. 1992:2335-407.
- Kim EJ, Han KS, Lee MG. Gastrointestinal first-pass effect of furosemide in rats. J Pharm Pharmacol. 2000 Nov;52(11):1337-43.
- Westphal JF, Brogard JM. Drug administration in chronic liver disease. Drug Saf. 1997 Jul;17(1):47-73.
- Wolf CR, Smith G. Pharmacogenetics. British Medical Bulletin. 1999;55(2):366-86.
- Colombo S, Buclin T, Cavassini M, et al. Population pharmacokinetics of atazanavir in patients with human immunodeficiency virus infection. Antimicrob Agents Chemother. 2006 Nov;50(11):3801-8.
- Ruhnke M, Yeates RA, Pfaff G, et al. Single-dose pharmacokinetics of fluconazole in patients with liver cirrhosis. J Antimicrob Chemother. 1995 May;35(5):641-7.
- Kumar R, Chawla YK, Garg SK, et al. Pharmacokinetics of omeprazole in patients with liver cirrhosis and extrahepatic portal venous obstruction. Methods Find Exp Clin Pharmacol. 2003 Oct;25(8):625-30.
- Kelly MR, Cutler RE, Forrey AW, et al. Pharmacokinetics of orally administered furosemide. Clin Pharmacol Ther. 1974 Feb;15(2):178-86.
- McCrindle JL, Li Kam Wa TC, Barron W, et al. Effect of food on the absorption of frusemide and bumetanide in man. Br J Clin Pharmacol. 1996 Dec;42(6):743-6.
- Wolf-Coporda A, Lovric Z, Huic M, et al. Determination of bioequivalence of two furosemide preparations; the effect of high doses of furosemide on some pharmacokinetic parameters.. Int J Clin Pharmacol Res. 1996;16(4-5):83-8.
- Rupp W. Pharmacokinetics and pharmacodynamics of Lasix. Scott Med J. 1974;19 Suppl 1:5-13.
- Cutler RE, Blair AD. Clinical pharmacokinetics of frusemide. Clin Pharmacokinet. 1979 Jul-Aug;4(4):279-96.
- Johansson LC, Frison L, Logren U, et al. Influence of age on the pharmacokinetics and pharmacodynamics of ximelagatran, an oral direct thrombin inhibitor. Clin Pharmacokinet. 2003;42(4):381-92.
- Shinkuma D, Hamaguchi T, Kobayashi M, et al. Effects of food intake on the bioavailability of sulpiride from AEA film-coated tablet having a pH-dependent dissolution characteristic in normal or drug-induced achlorhydric subjects. Int J Clin Pharmacol Ther Toxicol. 1991 Aug;29(8):303-9.
- Bradford CR, Prentice AG, Warnock DW, et al. Comparison of the multiple dose pharmacokinetics of two formulations of itraconazole during remission induction for acute myeloblastic leukaemia. J Antimicrob Chemother. 1991 Oct;28(4):555-60.
- Ramachandran A, Balasubramanian KA. Intestinal dysfunction in liver cirrhosis: Its role in spontaneous bacterial peritonitis. J Gastroenterol Hepatol. 2001 Jun;16(6):607-12.
- Gumurdulu Y, Yapar Z, Canataroglu A, et al. Gastric emptying time and the effect of cisapride in cirrhotic patients with autonomic neuropathy. J Clin Gastroenterol. 2003 Feb;36(2):175-8.
- Ishizu H, Shiomi S, Kawamura E, et al. Gastric emptying in patients with chronic liver diseases. Ann Nucl Med. 2002 May;16(3):177-82.
- Gonzalez G, Arancibia A, Rivas MI, et al. Pharmacokinetics of furosemide in patients with hepatic cirrhosis. Eur J Clin Pharmacol. 1982;22(4):315-20.
- Verbeeck RK, Patwardhan RV, Villeneuve JP, et al. Furosemide disposition in cirrhosis. Clin Pharmacol Ther. 1982 Jan;31(6):719-25.
- Traeger A, Hantze R, Penzlin M, et al. Pharmacokinetics and pharmacodynamic effects of furosemide in patients with liver cirrhosis. Int J Clin Pharmacol Ther Toxicol. 1985 Mar;23(3):129-33.
- Allgulander C, Beermann B, Sjogren A. Frusemide pharmacokinetics in patients with liver disease. Clin Pharmacokinet. 1980 Nov-Dec;5(6):570-5.
- Thomson PD, Melmon KL, Richardson JA, et al. Lidocaine pharmacokinetics in advanced heart failure, liver disease, and renal failure in humans. Ann Intern Med. 1973 Apr;78(4):499-508.
- Klotz U, Avant GR, Hoyumpa A, et al. The effects of age and liver disease on the disposition and elimination of diazepam in adult man. J Clin Invest. 1975 Feb;55(2):347-59.
- Lewis GP, Jusko WJ. Pharmacokinetics of ampicillin in cirrhosis. Clin Pharmacol Ther. 1975 Oct;18(4):475-84.
- Sawhney VK, Gregory PB, Swezey SE, et al. Furosemide disposition in cirrhotic patients. Gastroenterology. 1981 Dec;81(6):1012-6.